Uptrend's Account Talk

Certianly did not see this coming, as far as technicals. Usually, as many times in the past that I can show you, when breadth picks up, so does the market. So I expect this sell-off to be contained. SPX 1372 is support, and if that is breached, then a re-test of the 1359 lows. Not many warning signs, other than bonds and contrarian sentiment turning. The intermediate term trend, other than the I fund, has not given in to a sell "yet." Remember, investing is a long term process. The market is getting very oversold at the moment.
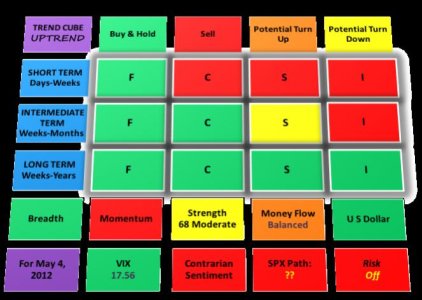
cube_05_04_12.jpg
 
I wonder how it will end today. I wonder how it will go on Monday after the French and Greek elections. The French election result for Hollande may be already priced in.
 
I wonder how it will end today. I wonder how it will go on Monday after the French and Greek elections. The French election result for Hollande may be already priced in.

Not going so great, unless you are out of the market. The uptrend confirmation in the intermediate term trend fell apart, which does not happen very often.
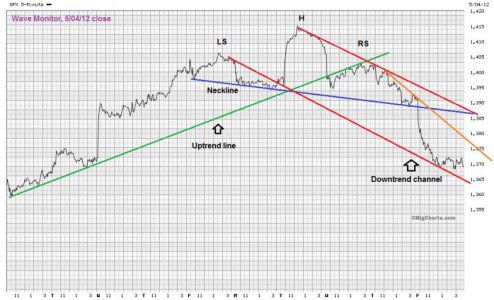
My SPX wave monitor, which I may post once or twice a week shows the SPX is now in a downtrend. The ABC correction is back in play; but still within a bull market. We are in the C wave, and 1372 is overhead resistance. The previous 1315-1286 target is back on the table. So much for the B wave extension. The head and shoulders pattern broke down.

BC_05_04_12.jpg

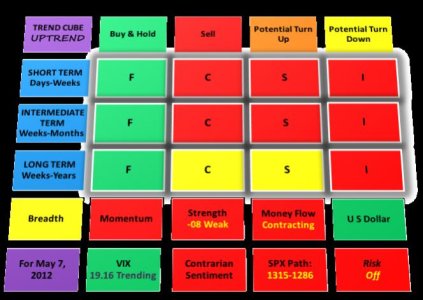
Here is Mondays trend cube. Breadth lags, but should turn red by Tuesday or Wednesday.

cube_05_07_12.jpg
 
Not going so great, unless you are out of the market. The uptrend confirmation in the intermediate term trend fell apart, which does not happen very often.
My SPX wave monitor, which I may post once or twice a week shows the SPX is now in a downtrend. The ABC correction is back in play; but still within a bull market. We are in the C wave, and 1372 is overhead resistance. The previous 1315-1286 target is back on the table. So much for the B wave extension. The head and shoulders pattern broke down.

View attachment 18768

Nice Chart, great looking 5min H&S, I'm not surprised it's surpassed it's PO, downward sloping H&Ss don't perform as well.
 
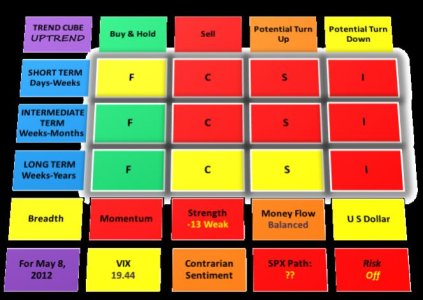
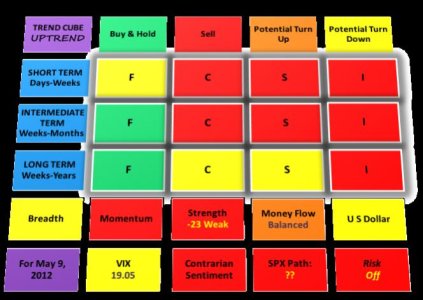
Here is todays trend cube. If a reversal is going to happen, now is the time. Otherwise breadth is going red, and various H&S necklines will be broken, and another bigger drop will be underway. Contrarian Sentiment turned bullish yesterday; near an extreme. However, bonds told a different story with shooting star candlesticks, which are not playing out today.

cube_05_09_12.jpg
 
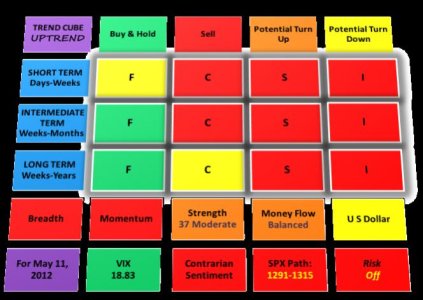
Trend cube for today. I can see a bounce to SPX 1372-1386 before heading lower, that I will detail in a weekend blog. Internals under the market are not good and the surprises continue to disappoint. The cube has not indicated a C,S,I short term trade at this time.

cube_05_11_12.jpg
 
hey uptrend, love your stuff, quick question, after the "S" fund attempt to hit 690 today, and failing, and u thought that 696 was the "go away in may" signal, what might u ponder now?????? thanxs for your wisdom...
 
hey uptrend, love your stuff, quick question, after the "S" fund attempt to hit 690 today, and failing, and u thought that 696 was the "go away in may" signal, what might u ponder now?????? thanxs for your wisdom...

Well, the trend is down. And the Wilshire 4500 is below 677.36 at 675.71 right now, so the H&S pattern may be playing out. That would be an approximate 45 point drop coming, so todays close will be critical.

The trend cube is still on the right side of the trade. The F fund is still sunny.

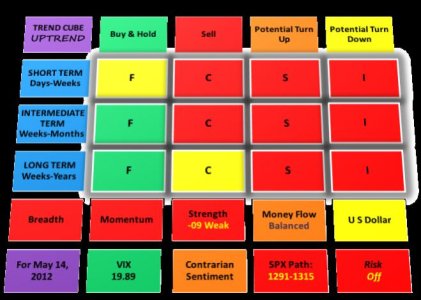
cube_05_14_12.jpg
 
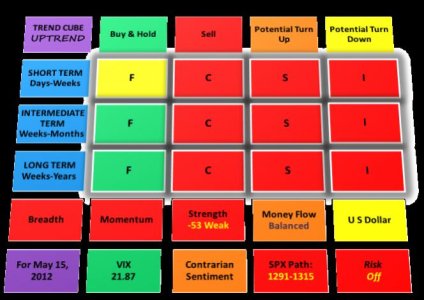
Todays update. As you can see the trend cube is now all red for C, S and I. And it appears the market is close to a bottom. The futures are up this AM, so we will see where it goes. I am thinking a few days pop and then a lower low next week to finish the correction, but that is only a guess.

cube_05_15_12.jpg
 
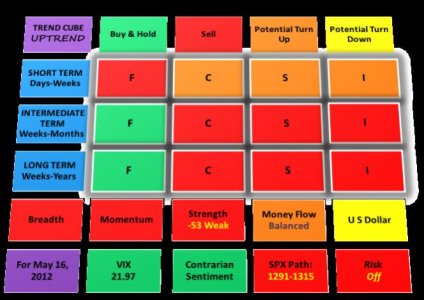
Trend cube update. Contrarian sentiment is now bearish, which is bullish for stocks. A shift in the short term trend has happened this AM, but whether it will hold is anyone's guess. Is this the facebook run, and then a drop to lower lows, or is this it? SPX was near a fibonaccit 0.382% retracement (overshot by 10 points) from the last major wave 1202-1422. I still think the market may go lower, and this is a trial bounce, but it is only a guess. I would like to see the fibonacci relationships line up on the numbers and not between the numbers.

cube_05_16_12.jpg
 
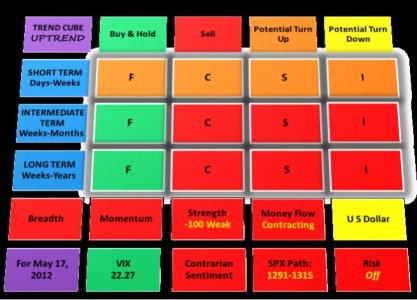
Today the top side of the SPX path (1315-1291) has been tagged when the market touched 1315 near the opening. Strength is very weak. Bonds are thinking about turning up again, while the dollar is thinking about turning down. This looks like a bottoming process to me.

cube_05_17_12.jpg
 
Today the top side of the SPX path (1315-1291) has been tagged when the market touched 1315 near the opening. Strength is very weak. Bonds are thinking about turning up again, while the dollar is thinking about turning down. This looks like a bottoming process to me.

View attachment 18905

Uptrend...i think i checked your account talk about a half a dozen times today to see if you had commentary on today's action...very curious to see what you have to say. Thanks for all your great posts.
 
Uptrend...i think i checked your account talk about a half a dozen times today to see if you had commentary on today's action...very curious to see what you have to say. Thanks for all your great posts.

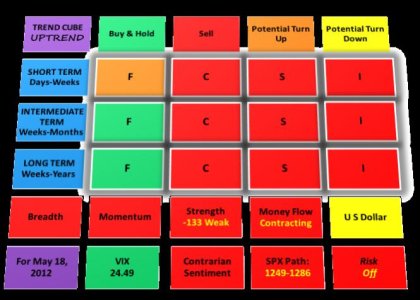
Thanks. The trend cube does not have feelings. It is objective and deals with facts. BTW, the cube has been out of the market in the short and intermediate term trend since May 7 (@1369 for SPX and has avoided a drawdown of 4.7% so far). Because of the speed of the decline, I have put a updated SPX path on the cube:1249-1286. This is based on fibonacci relationships. The market is very oversold, but wants to keep going down. Facebook is hardly fazing it. Strength on the cube is very weak at -133. The US dollar is flirting with turning down, but can't quite do it.

cube_05_18_12.jpg
 
I understand...there are so many intangibles that models cannot account for...BTW I have been out of the market since 28 April...waiting for the cube to flip...and then will probably add a couple of days of buffer for insurance...thanks again.
 
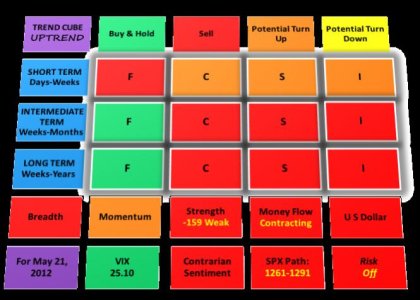
Trend cube for today. The market is weak and trying to turn up. SPX is in the 1303 pivot area, and if it clears it, then it is 1321 and 1340 for resistance. US dollar has turned down, and bonds were a sell, then trying to turn up for several days, and now back on sell (red). Momentum is trying to turn up. Contrarian sentiment (the way I figure it) is lagging and sitting on a sell. So it is mixed.

cube_05_21_12.jpg
 
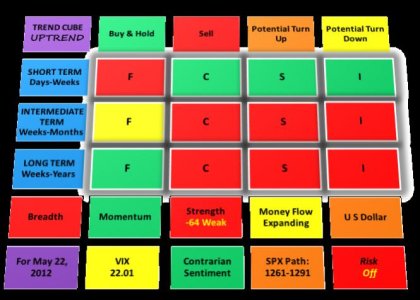
cube_05_22_12.jpg

Today we see the short term time frame turn up to green. Momentum is up and contrarian sentiment is green. Bonds are down on a sell in the short term time frame.

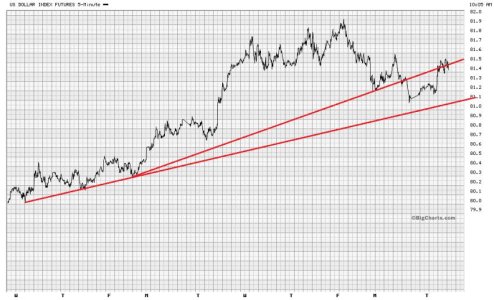
I am not sure we have seen the lows because: 1) While the Wilshire dropped below the 200 ma and recovered, the SPX stopped above it, 2) No exhaustion candle on SPX or Wilshire 4500, but one on EFA, 3) US dollar is above the trendline as shown in the 10 day 5-min chart below (so far today), and has not really decided to turn down, and 4) the SPX 1291 pivot area was not really tested and I think a retest is likely. Bonds however, are dropping today which are supporting equities. This pop could be profitable for several more days; just to hard to tell at this point.

US_dollar_05_22.jpg
 
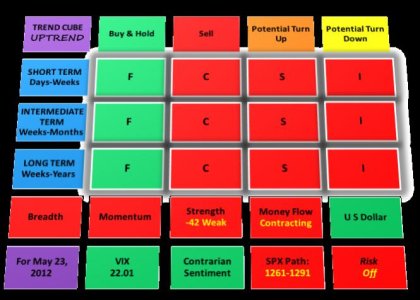
US dollar as UUP is up almost 1%. This is killing the advance as I suspected in my last post this AM. Must be fear over Europe.
 
cube_05_23_12.jpg

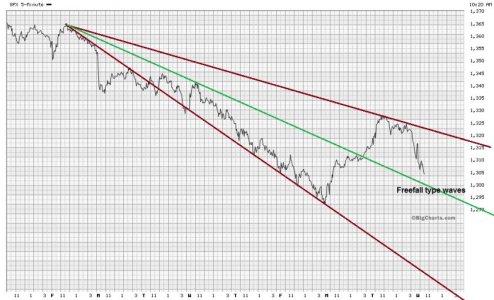
The market has turned back down. The market is playing out bearish and fooling contrarian sentiment. The US dollar is still leading as I pointed out yesterday. Notice the impulse freefall type waves on the SPX 5 min chart.

SPX_freefall.jpg
 
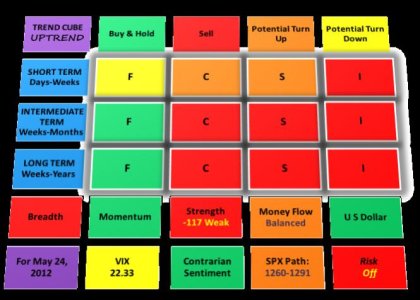
The market is at a tipping point and could go either way. The US dollar rise still has not given up and that is pushing down equities. Risk on in the currency markets has not shown a bottom yet. Breadth is still pointing down, but usually lags by 2-3 trading sessions. However, SPX has a higher low and has minimally hit the fibonacci projection, but not a classic test. I keep watching the futures for clues, and they are sitting on the fence. The real thing or a fake-out is the question. The jet is sitting on the runway in first position to take-off, but there are a few warning lights indicating engine trouble. Ignore and take-off anyway or taxi back to the jetway?

cube_05_24_12.jpg
 
Back
Top