Uptrend's Account Talk

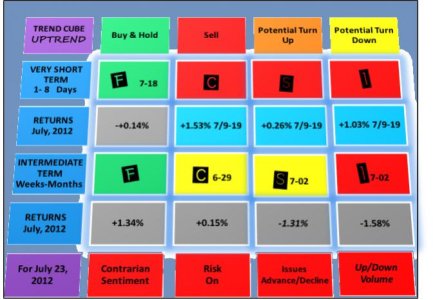
Market in semi-freefall this AM. The turn date proved correct. The cube intermediate term trend is starting to fail, and the I fund sold. The others should follow. That trend was a false start, and in this environment (Europe the way it is) the very short term trades (momentum trades) are more reliable.

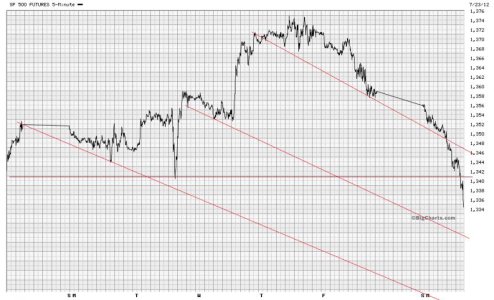
The market may bounce at SPX 1340, but because of the speed and severity of the drop, IMO there is more to come. I have shown the SPX futures, but keep in mind there is about a 5 point differential between that chart and the SPX cash. Also on the cube, it should say Risk Off.


07_23_12.jpgSPXF_07_23_12.jpg
 
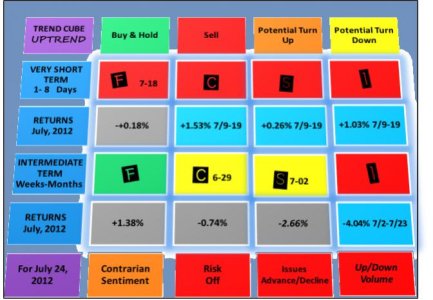
SPX 1340 support area is being tested today. If this fails, then 1313 should be next, but I am not real sure it will happen. I notice the institutions have been accumulating a lot of Apple the last few days. And several charts of mine, in addition to what was shared in my recent blog, suggest a big rally around the corner. Bonds are topping and the cube very short term trade went to sell. However, they should take off again if the SPX 1340 area is breached below 1334. Breadth indicators are negative, but are setting up for a breadth thrust; at least the formation is there and this is bullish.

cube_07_24_12.jpg
 
SPX 1340 support area is being tested today. If this fails, then 1313 should be next, but I am not real sure it will happen. I notice the institutions have been accumulating a lot of Apple the last few days. And several charts of mine, in addition to what was shared in my recent blog, suggest a big rally around the corner. Bonds are topping and the cube very short term trade went to sell. However, they should take off again if the SPX 1340 area is breached below 1334. Breadth indicators are negative, but are setting up for a breadth thrust; at least the formation is there and this is bullish.

View attachment 19690

Betting on APPL, a lot of people would consider a safe bet given its track record. Given this last 3-day triple digit slide though, if they don't meet expectations in today's report, the selloff could be massive.
 
Re: Uptrend's Account Talk

quote_icon.png
Originally Posted by Uptrend
SPX 1340 support area is being tested today. If this fails, then 1313 should be next, but I am not real sure it will happen. I notice the institutions have been accumulating a lot of Apple the last few days. And several charts of mine, in addition to what was shared in my recent blog, suggest a big rally around the corner. Bonds are topping and the cube very short term trade went to sell. However, they should take off again if the SPX 1340 area is breached below 1334. Breadth indicators are negative, but are setting up for a breadth thrust; at least the formation is there and this is bullish."

Betting on APPL, a lot of people would consider a safe bet given its track record. Given this last 3-day triple digit slide though, if they don't meet expectations in today's report, the selloff could be massive.

I went all in on today's weakness...also betting on AAPL! :nuts:

What I am wondering, UPTREND, is why you moved to G. Your own charts seem to indicate a rebound now that S&P is under 1340. Are you still holding out for a lower low??? :confused:
 
I went all in on today's weakness...also betting on AAPL! :nuts:

What I am wondering, UPTREND, is why you moved to G. Your own charts seem to indicate a rebound now that S&P is under 1340. Are you still holding out for a lower low??? :confused:
dang, missed earnings report, good thing i held my hand, was close to buying some shares. i thought an earnings beat by apple would boost the market, but a miss would be bad.

with that said, if aapl drops to 550 or below I'm buying the dips
 
I went all in on today's weakness...also betting on AAPL! :nuts:

What I am wondering, UPTREND, is why you moved to G. Your own charts seem to indicate a rebound now that S&P is under 1340. Are you still holding out for a lower low??? :confused:

I am following my very short term trade on the trend cube, and will be trading that signal going forward. And, I am out of trades until August 1.
 
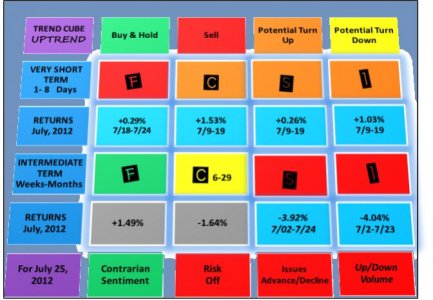
Not around on 7/25, so here is the cube. Happy trading everyone. The color blue on the returns line means the trade is over, the slate will be wiped clean and the trades shown on another spreadsheet. Active trade returns are shown in gray. The intermediate trend for TSP S, and I and perhaps C has been a failure. The same parameters in Jan-Feb would have been near +12%.

cube_07_25_12.jpg
 
We have a pop early, but it is anyones guess if it will hold. The cube will shift to green for Risk-on, Volume and A/D line if this does not turn down today. Some indicators I have suggestthis could be the start of a huge rally, or a fake-out start. Need a little more data. Todays cube.

cube_07_26_12.jpg
 
Uptrend are you around? I'm missing the daily cube :worried:
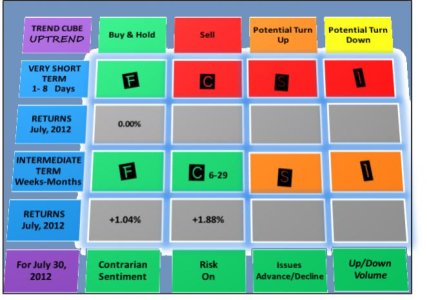
I am on vacation and won't be posting much for the next two weeks, but will try and update the cube every couple of days or when things trigger. The short term trade for C, S & I did not trigger in time last week, so it is a miss and the system waits for the next rotation. There is no chasing involved. Short term trade F fund triggered at the close last Friday. Last weeks move was a giant short squeeze and took off when the market was not that oversold. In the intermediate term trend on the cube, TSP C fund has been on buy since 6/29. S and I sold at a loss and have not entered again yet. The market is mixed up and hard to trade right now and is fooling many technical systems. Also of note, the Hidenberg Omen triggered twice last week, and if played out; a 5-20% market correction could occur anytime. It does have a high failure rate (will not happen), but is scary and worth considering. Read about it here.

We Get An Official Confirmed Hindenburg Omen On July 24th, 2012 | Robert McHugh | Safehaven.com

cube_07_30_12.jpg
 
My cube intermediate trend C fund sells and goes to G today. Internals under the market are poor. I will be back later in the week.
 
Ok I'm back, and will be posting on a regular basis soon. The F fund is lining up for a buy today; MACD upticking, momentum shift. SPX looks like it could relax a little after it's August run. It always happens while I am on vacation. My master charts on equaities hint at a little downside here, but not sure how much. The SPX 1440 target is still on the table. Downside is probably limited to 1390 ish. More later.
 
The USD gapped down on Tuesday and has been falling while the Euro rallies. Meanwhile equities have been sideways to down. It should be the other way around. Odd.
 
Cube update. F is doing well this week. After reviewing the charts, downside on SPX and EMW may be limited. Euro is still in rally mode, but getting toppy in daily timeframe.

cube_08_24.jpg
 
Back
Top