Tsunami's Account Talk

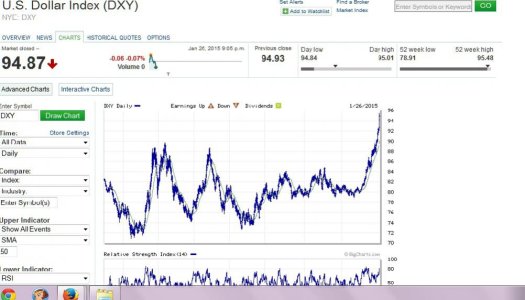
Once again a very nice post here. I like this Fund tally Cactus. If I just use persistence, often an under utilized concept, the I fund will continue to outperform especially in the environment of QE Europe, overbought Dollar Rally (Dollar correction coming here...look at that RSI of 80+ over the last decade...always followed by big correction), and like I said...until this low interest rate environment is reversed...the only place to put money to work is in equities? You could go safe...but then we have seen where going safe has absolutely decimated returns over the last several years. :nuts:
 

Attachments

  • Dollar.jpg
    Dollar.jpg
    70 KB · Views: 232
Whoosh, SPX down to 2045...odds are getting high that the bull market has peaked. A break of the previous low near 2040 would just about confirm it. Looking for a wave 2 bounce here though first before 2040 is taken out.

Looks like sell in May and go away came early this year. Ultimately I'm expecting a 35-40% bear market, with a big bounce in the middle somewhere, and the final bottom some time in 2016.

Wow, you think the S&P will head down to ~1300? That's a bold call!
 
Wow, you think the S&P will head down to ~1300? That's a bold call!

Yep, once 2040 is broken (tomorrow?) then in my opinion the odds are high that the 3rd bear market of this century has begun. It won't be quite as bad as the last two hopefully, but bad enough to do a lot of damage. :sick:

There are tons of people hoping to retire in my agency (and all others) in the next few years (including me, and 7 out of 8 people in my office plan to go by 2017) and this could change a lot of people's plans. I'm playing it safe and trying not to get caught up in it. The underlying cause of this one is simple demographics. This is the result of the tsunami of Baby Boomers retiring and reducing their spending...and try as they might there's NOTHING the Fed can do about it...I expect this panic to end next year before the elections when the Treasury will start sending out checks directly to tax payers to stem the bleeding...in a few more years the next spending wave of the Millenials will take over and we'll be moving into the next economic boom. The 2020's and well beyond should be great for the markets, but until then we have this plunge and maybe one more lasting to about 2023 to get through.
 
Last edited:
There are tons of people hoping to retire in my agency (and all others) in the next few years (including me, and 7 out of 8 people in my office plan to go by 2017) and this could change a lot of people's plans.

If those people are that close to retirement, why do they have so much at risk?!
 
If those people are that close to retirement, why do they have so much at risk?!

That's what happens at market tops; over-confidence. I asked a coworker today, a guy who's 62 and planning to retire next year...he had been in the G fund for the last 5 years, never moved...but today he tells me he's moved 50% back into stocks.

Market is at a cross-roads at the close today. 2088 is either a perfect wave 2 rally and we'll head down very soon in a wave 3....or the bulls will have successfully defended 2040 and we'll be at new highs by next week...most likely that would be the final high though, somewhere below 2180 before May 1st. Today's move was so strong it would seem the short-term bullish case is the answer, but Ms. Market loves to fool the most people....the bar has been raised for the bulls to defend...a 62% retracement from 2045 to todays high of 2089 would be a pullback to about 2062...so anything below 2060ish starts to confirm the top is in.

Ah, here we go...I hate referring to Daneric since he's a perma-bear and has had the wrong Elliott Wave count for years, but today (Monday 3/30/15) he's finally has the two possible counts I'm referring to....either a wave 3 down below 2000 is imminent, or one more minor high is needed first...the latter higher high would be preferred...
Daneric's Elliott Waves
 
Last edited:
Right. Also, the talking heads are seriously claiming that the market is rigged because folks choose to buy stocks at incredible p/e ratios, only to find them (their stocks) correct later.:blink:

The beginnings of irrational exuberance? I sure hope so, should be some profitable times for a few.

That's what happens at market tops; over-confidence. I asked a coworker today, a guy who's 62 and planning to retire next year...he had been in the G fund for the last 5 years, never moved...but today he tells me he's moved 50% back into stocks.

Market is at a cross-roads at the close today. 2088 is either a perfect wave 2 rally and we'll head down very soon in a wave 3....or the bulls will have successfully defended 2040 and we'll be at new highs by next week...most like that would be the final high though, somewhere below 2180 before May 1st. Today's move was so strong it would seem the short-term bullish case is the answer, by Ms. Market loves to fool the most people.
 
If those people are that close to retirement, why do they have so much at risk?!
i can speak for myself by saying I stayed in c s I and l2040 funds after I retired for several reasons. Retired in May 2014 and before I did I had already decided to leave it alone since the market seemed to be in a bull market and I was willing to work with it. I also had decided that I was going to live off my pension and not touch tsp (some may be wondering what is a pension heehee). As you know once retired you can't contribute, but since May to now I was pleasantly surprised to see my account had grown an additional $18000 with no input. Now if I can do that every 10 months I would be golden. I realize one day I will need to pull the trigger but not yet. I'm depending on you all to give me the step aside signal when the time comes. Thanks to this MB
 
Well after that late plunge in the last minute I have to give the odds to the bears and the bearish wave count is winning out...which should mean a gap down and go (down) tomorrow....I could be an April Fool on that call for sure but for the moment I'm content still sitting on the lilly pad.
 
Whoooosh, the tsunami is sweeping ashore after hours. Welcome to the 3rd bear market of the 21st century. When this one is over in a year or 18 months or so I'll need to change my name to something more positive since I'll be as bullish as Birchtree.


Well after that late plunge in the last minute I have to give the odds to the bears and the bearish wave count is winning out...which should mean a gap down and go (down) tomorrow....I could be an April Fool on that call for sure but for the moment I'm content still sitting on the lilly pad.
 
Took a while, but the bulls have won out...looks like new highs coming above 2120 are coming soon...now the question is whether the wedge completes somewhere below 2180 or if the bulls blow through that too...


After seeing things like this sweet chart of sugar breaking out (and other similar setups), seems like the bulls are about to take over big time.
Print SharpCharts from StockCharts.com

So tomorrow will decide which way the Easter indicator goes....
 
The many indicators on this nice chart show how the market is vulnerable to another 2000 and 2007 type of top. I don't think the coming bear market will be quite that bad, but it will be bad enough and it's looking doubtful the market will hold out to the August 6th cycle date shown on the second chart below. I think the coming high above 2120 might be about 2121 and th...th...th...that's all folks.

Print SharpCharts from StockCharts.com

Print SharpCharts from StockCharts.com

https://www.youtube.com/watch?v=saQJ8z4714w :laugh:
 
The market is so weak that it couldn't even make those last few points to a new high at 2120. Today's break of the late March peak of 2089 is the initial confirmation that the top is in.
It will be interesting as this develops how people try to answer the question of "why?", why is it falling? Greece....the shrinking GDP...Iran...deflation...Hillary announcing her candidacy LOL...no, it's none of those and I just laugh at the confused gurus on TV and in print that will try to explain it. The reason is simply that the waves have reached their termination point, a powerful ending diagonal wedge that will break down hard very soon...and the fundamental reason behind the coming bear market is simply that baby boomers are retiring in droves now and cutting back spending. There's simply not enough spending to support a strong growing economy and until we get through this trough in demographics we'll have to endure this bear market and probably another similar one in 7 years. This will be a huge wave 2 down, perhaps 35% or so correcting the wave 1 rally since March 2009....18 months would be normal but it could go quicker....it will likely follow a large A-B-C pattern, with wave B up later this year being investable if one can catch that wave...the wave C down likely larger than this initial wave A down, 1.62 times wave A is the normal amount.

Though further breaks of support like at 2040 are needed for confirmation, it looks to me like the tsunami is sweeping ashore. But I'm safely watching on high ground and hope to see others join me (and even went short in my other accounts yesterday with things like TZA and QQQ puts, doing well there will get me to my goal of retiring next year) ...then wave 3 up starting next year will be quite a ride that nobody should miss.


Here's another of many charts that warned of the top:
Print SharpCharts from StockCharts.com

And another...
Print SharpCharts from StockCharts.com

Meanwhile for gold, looking for a final bottom in June Perhaps, likely below $1000. I'll be buying some miners at that time and maybe some physical metal too...
Print SharpCharts from StockCharts.com
 
Back
Top