tsptalk's Market Talk

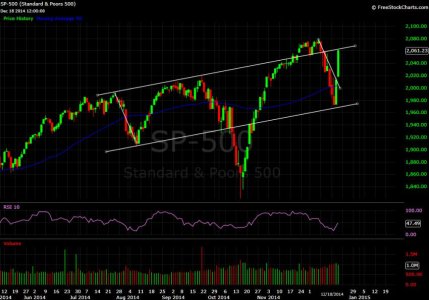
Well we made that right shoulder in a hurry! Only took 2 days to retrace up through the channel. Wow. I could see a little sidewards action or slight consolidation for a few days before breaking through the channel ceiling, but that is a complete guess.

SPX 18DEC14.jpg
 
Right.

This...

HS3.gif


Or this?...

HS4.gif
 
The computer algorithmic trades are robbing us of our possible gains! Welcome to the new world!
 
No rest after 700+ point rally. S&P 500 flirting with new closing high today. Resistance or breakout?

1219140107a.gif


I usually prefer to use the SPY chart, but there's been a bad tick on it for a couple of days.
 
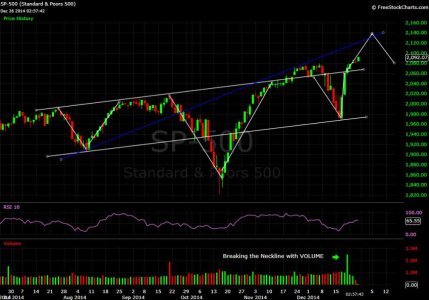
With the right shoulder complete, the S&P 500 appears to be climbing up this follow-on pattern to the Inverted H&S setup. Looks good so far.

SPX 26DEC14.jpg
 
Hmmm, another positive day with a weak close...

1226140208a.gif


1226140208b.gif

I've seen that too. I don't know if it is a big enough move to imply that da'Boyz (as CoolHand calls em) are selling on strength or if it is normal window dressing to make poor performing mutual funds look better. The performance hasn't been strong so the chart look abysmal when the down move is actually quite small...
 
Agree. And volume was so low that someone may be just pushing things around.

Another thought I had is it may be money managers trying to slyly dumb oil related stocks (or any 2014 losers) to get them off their annual reports.
 
Agree. And volume was so low that someone may be just pushing things around.

Another thought I had is it may be money managers trying to slyly dumb oil related stocks (or any 2014 losers) to get them off their annual reports.

Sector Tracker - Track the movement of the 9 Sector SPDRs

This is a fun tool to play with and check in on periodically. Comparing Energy to the S&P 500 shows some interesting results. It looks like money is definitely coming out of Energy and into the other sectors over time, but yesterday wasn't too bad. It also shows money is moving into the defensive Utilities sector pretty heavily.
 
The defensive move is a bit scary. I think I have noted Starbucks lowering its prices a bit. Maybe some other full restaurants as well. We are talking small amounts, but I have noticed that the change I get provides a bigger tip:o. I tracked on that in 2007. We might be in for a drawdown just as the news is looking good. Not ready to make a move yet. Especially since money is moving out of energy - I might actually beef of the 'C Fund' to take advantage of that...
 
This is the third trading day in a row now the S&P 500 lost almost all of its gains in the final minutes of the session. We saw decent rallies the morning after in the previous 2 days.
 
This is the third trading day in a row now the S&P 500 lost almost all of its gains in the final minutes of the session. We saw decent rallies the morning after in the previous 2 days.

S&P 500 has put in a daily higher high for 8 days straight now. We have seen a late-day sell-off over the past 4 days, I'll be watching for a close over/under 2089.
 
Good morning JT. I was wondering if you have any targets of where you think the market is headed? I realize we are in unchartered territory. I feel like exiting the market but my gut says we could go 2-3 percent higher before we have another meaningful correction. I would like to use your targets as a guide to help make my decisions. Thanks and Happy New Year to everyone.
 
For what it's worth, since 1997, there have been 7 years that started the year with a loss in the S&P, after a negative last day of the year. 2008 was flat, but every other one of them saw gains on the 2nd trading day of the year.


[TD="class: xl64, width: 67"]Last Day[/TD]
[TD="class: xl63, width: 70"][/TD]
[TD="width: 71"][/TD]

[TD="class: xl64"] of Prior[/TD]
[TD="class: xl64"]1st Day of[/TD]
[TD="class: xl64"]2nd Day of[/TD]

[TD="class: xl64"]Year[/TD]
[TD="class: xl64"]New Year[/TD]
[TD="class: xl64"]New Year[/TD]

[TD="align: right"]2008[/TD]
[TD="class: xl65, align: right"] -0.69% [/TD]
[TD="class: xl65, align: right"] -1.44% [/TD]
[TD="class: xl65, align: right"]+0.00%[/TD]

[TD="align: right"]2007[/TD]
[TD="class: xl65, align: right"] -0.45% [/TD]
[TD="class: xl65, align: right"] -0.12% [/TD]
[TD="class: xl65, align: right"]+0.12%[/TD]

[TD="align: right"]2006[/TD]
[TD="class: xl65, align: right"] -0.49% [/TD]
[TD="class: xl65, align: right"] -1.44% [/TD]
[TD="class: xl65, align: right"]+0.37%[/TD]

[TD="align: right"]2002[/TD]
[TD="class: xl65, align: right"] -1.11% [/TD]
[TD="class: xl65, align: right"] -0.95% [/TD]
[TD="class: xl65, align: right"]+0.92%[/TD]

[TD="align: right"]2001[/TD]
[TD="class: xl65, align: right"] -1.04% [/TD]
[TD="class: xl65, align: right"] -2.80% [/TD]
[TD="class: xl65, align: right"]+5.01%[/TD]

[TD="align: right"]1999[/TD]
[TD="class: xl65, align: right"] -0.22% [/TD]
[TD="class: xl65, align: right"] -0.50% [/TD]
[TD="class: xl65, align: right"]+1.36%[/TD]

[TD="align: right"]1997[/TD]
[TD="class: xl65, align: right"] -1.74% [/TD]
[TD="class: xl65, align: right"] -0.09% [/TD]
[TD="class: xl65, align: right"]+1.50%[/TD]
 
Thank you! I have a lot to learn but it sure is impressive to see the stats and numbers you pull together and publish.:)
 
You're welcome. But now it looks like the S&P might close with a small gain, so disregard that last post. :D
 
So it's slightly down. Monday will be really interesting I hope. Thanks again and have a good weekend.
 
Back
Top