tsptalk's Market Talk

Oil is currently hitting $76 a barrel. That sounds like a good sign for the economy as demand rises, but at what price does it start to become a problem for consumers and the market? :pat:


In Oregon, I think it has already gotten there (at least once the pent up demand for travel vacations and visits is satiated).
 
The S&P 500 and Nasdaq are doing well this morning, while small caps and the I-fund struggle.

That's a possible inverted head and shoulders on the Russell 2000 (IWM) below, which could mean today is making a low in that right shoulder. If 228 doesn't hold, that would change things.

070221a.gif


The I-fund is struggling despite the dollar pulling back. This needs to find support quickly, or....

070221b.gif
 
Small caps (Russell 2000 and DECPF S-fund index) are struggling this morning and trying to hold onto support.

070621a.gif
 
In case you missed it, this is from today's commentary:

For the first time in a while we got a better than expected jobs report. The May report topped estimates by about 150,000 jobs, which is a monster beat, although the unemployment rate did move up to 5.9%. In early May we got the April jobs report and it was a big miss. Stocks rallied. In early June we got the May report. Another miss. Stocks rallied. Now we get a nice healthy report that beat estimates and... stocks rallied.

070621t.gif


The problem with the prior rallies is that they didn't really follow through the following week. Three Friday rallies but In May stocks tumbled right after the weekend, and in June the rally stalled the following Monday but didn't pull back for another week or so. Now we have a beat instead of a miss, so will it be different this time?


070621d.gif
 
10-year down to 1.3%, and falling fast. The price of oil is down sharply again, and small caps as well.

Something is happening. Be careful!
 
Early action had yields down, but the dollar down as well for a change, and a possible break from the recent uptrend, although the 200-day EMA is just below.
070821b.gif


070821c.gif
 
The S-fund has been in quite the range this year, and if it so chooses, there's a lot of room at the bottom of the range. Right now it may be trying to create a small head and shoulders pattern, forming the right shoulder now and 2175 being the neckline. In bullish trending markets, H&S patterns are not necessary bad and can break to the upside. H&S patterns in bearish trending markets can be very bad, however. So this is a very interesting set up here.

070921a.gif
 
What do you know? Another mixed day for the market.

Bond yields are up for a second day (F-fund down). The S&P 500 is making a new high. Small caps are struggling after Friday's big rally, and the I-fund (EFA) is leading on the upside despite a small gain for the dollar in early trading.

071221a.gif
 
The dollar is rallying on the CPI number putting some pressure on prices - some more than others. It's off the opening highs, one gap was filled, another open, so it's tough to gauge which way it really wants to go.

071321b.gif


As I mentioned in the prior post, the 10-year yield moved up on the CPI report, but since then it has fallen back down, for some reason?

071321c.gif
 
The dollar is up, but yields are cracking again. What the heck? Are investors worried about inflation, or a slow down in the economy?

071521a.gif
 
The dollar is up this morning, although off the opening highs. We know about the I-fund's dependence on the dollar, but this chart shows just how much the S-fund (dwcpf) has disliked the rallies in the dollar in recent weeks.

071621a.gif
 
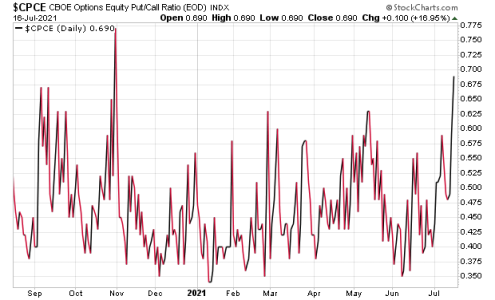
Any thoughts on the put/call ratio? Was just going through some charts and it stood out. Biggest spike since the election.

pcratio.png
 
Back
Top