tsptalk's Market Talk

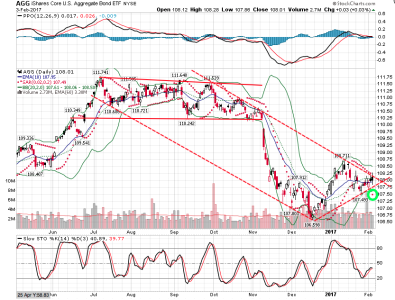
Another very interesting day. The Dow is up nicely (+60). S&P is basically flat (up 1). The Nasdaq 100 is getting hit hard (down 1%). Transports are up big (up 1%). Small caps are down slightly. Bonds are rolling over again. :scratchchin:
 
I see the indices are moving higher into the Fed announcement while bonds are slipping although still up slightly.

That's the logical direction considering it appears 20,000 is a magnet right now but wait for the dust to settle after the initial volatile reaction. We may not see the true reaction / direction until tomorrow since emotion is likely the catalyst today. It could get wild if there are any surprises.
 
The VIX hit a 16-month low this morning...

122116a.gif
 
The small cap fund had a bull flag breakout this morning. Needs to hold into the close.

010417a.gif


The S&P 500 is testing the top of its flag.

010417b.gif
 
Dollar falling hard. Gold and bonds up big. Stocks wavering.

The January seasonality chart might suggest a day 3 (not Jan 3) pause from the 2-day rally to start the year.

010517x.gif

Chart provided courtesy of www.sentimentrader.com
 
Big negative reversal so far in the dollar this morning. It ran up and filled two gaps, then backed down. Looks like a bear flag and it may test the 50-day EMA soon. Potentially good relative strength for the I-fund after today (in comparison to C and S?). The dollar is actually still positive today so that relative strength probably won't show up in tonight's I-fund price. It's when (if) the UUP breaks down from the flag that it may benefit the I-fund. This is not a recommendation to get in the I-fund. Just an FYI.

011117b.gif
 
The Trannies have so far successfully tested that double dose of support, but it is back below the 20-day EMA.

011817a.gif
 
The Transports have held at support so far and we're seeing a bounce off the at support this morning as the railroad stocks are doing well. There is some resistance at today's high which created a little pullback to test a new support line - created by last week's high. Looks like 9200 is that pace to watch for support now, and about 9300 for resistance.

011917a.gif
 
The S&P is breaking above the first resistance line of rising wedge, and nearing new highs and the top of the "F" looking flag...

020317a.gif
 
The S&P is breaking above the first resistance line of rising wedge, and nearing new highs and the top of the "F" looking flag...

020317a.gif

Does it look like it will break out? I think if we get any indication that the regulation on banks will be changed then we will see new highs. Mid 2300"s
 
Definitely not looking good for the F-Fund longterm. However, there may be a chance for a very short reprieve. PSAR uptrend dot formed outside the lower BB (circled in green on chart), majority of times that leads to a short-term PSAR uptrend. DISCLAIMER: I could easily be confused in reading the tea leaves; and as of COB yesterday I could be the F-Fund bag holder if I'm wrong :)
 

Attachments

  • Screen Shot 2017-02-04 at 8.19.03 AM.png
    Screen Shot 2017-02-04 at 8.19.03 AM.png
    152.2 KB · Views: 246
Carter Worth on CNBC agrees and sees a move in the 10-year treasury yield down to about 2.15% before the bear market in bonds resumes.

020417a.gif


I'm not sure I agree yet, but I can be persuaded :)... so thanks for your analysis, fedgolfer!
 
The dollar gapped up and broke its descending trading channel this morning, and is testing the 50-day EMA.

020717a.gif
 
Back
Top