tsptalk's Market Talk

GDP report beats expectations, +1.4% vs the predicted 1.0%. In the past this would have been good for the markets, in this central bank manipulated market though, who the heck knows? lol

I tell ya, I am so clueless on how fundamentals work, I only know they never do what I expect them to do and it usually ends up trading against me.
 
Central banks are running the show, and I guess it makes sense. Rates are too low to do anything but be in stocks, and any signs of that changing seems to panic the market, so the Fed doesn't want to do that, especially in an election year.

Were there any markets opened today that may have reacted to the higher than expected GDP?

Nope, looks like all markets are closed worldwide today. I guess Christianity did take over the world, huh? Wondering why the heck China or any country in Asia minus South Korea that would care about easter
 
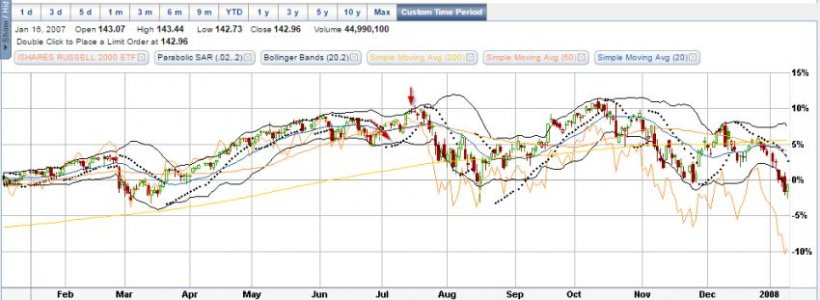
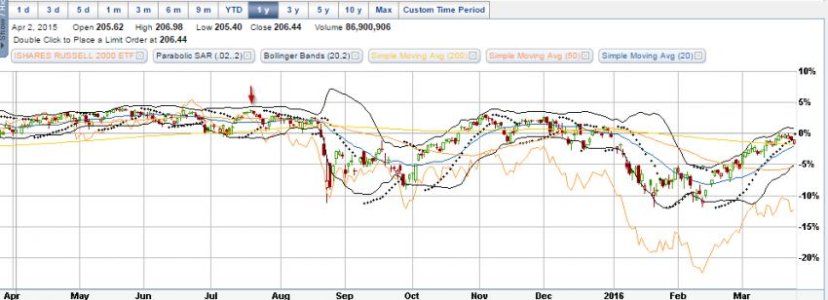
Just looking at some charts, I always kept hearing that when large caps outperform, that means a bull market is nearing its end. So out of curiosity, I went to look for myself and this seems to be true for 2008. Past doesn't always indicate what will happen in the future, but this is worrisome. The red arrows are where I saw the difference in large cap strength over small caps begin to increase. The chart is SPY, and the orange chart is the Russell 2000 (IWM).

2008
SPYvsIWM2008.jpg

Current
SPYvsIWMCurrent.jpg
 
Here's another possible sign of trouble. This is a monthly chart so of course there is no instant gratification, but the TRIX Indicator, is showing that we have already had the 2nd crossover so we may be in the cycle of the next big bear market.

032516a.gif
 
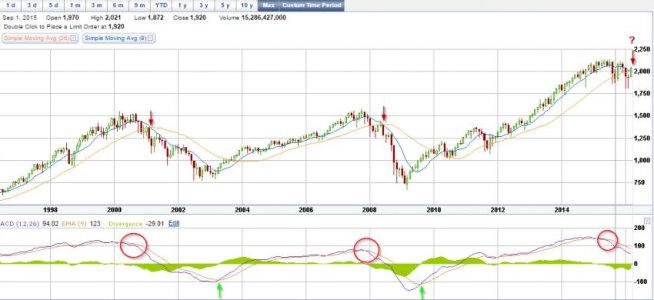
Piggybacking on that, here's a similar chart (S&P - monthly) dating back to 1996. Whenever the 9MA crossed the 26MA to the downside, a significant pullback happened. When MACD crossed upwards after the reversal, it was a safe time to get back in.

Red circles are when MACD divergence started to become noticeable to the downside, which could signal problems in the future

EDIT: The 9MA / 26MA lines haven't crossed yet to the downside, but it's really close right now.

SPYMonthly.jpg
 
Yellen quotes today:

"In other respects, economic and financial conditions remain less favorable than they did back at the time of the December FOMC meeting."

"In particular foreign economic growth now seems likely to be weaker than this year than previously expected, and earnings expectations have declined."

And stocks rally. :laugh:

Full speech
 
Yellen quotes today:

"In other respects, economic and financial conditions remain less favorable than they did back at the time of the December FOMC meeting."

"In particular foreign economic growth now seems likely to be weaker than this year than previously expected, and earnings expectations have declined."

And stocks rally. :laugh:
Pay no attention to the man behind the curtain. Everything is fine.

Sent from my SCH-I535 using Tapatalk
 
A little follow up on GLD. The gap was filled on Tuesday and that seems to be holding as resistance. I just sold half my position today (118.17) and if it looks like it is going to close below 118 today (too much resistance?) I will sell the rest before the close. Otherwise I have a stop in just below 117. Best case, it closes back in the pennant and we see the fake-out / breakout effect of a pennant.

033116a.gif


Like the AGG bond chart I post in my commentary, gold is also in a pennant formation and surprisingly the bullish pattern broke down - mostly because the dollar has been rising. But these patterns can do the fake-out / breakout dance so give it a few days to before declaring this a breakdown. Plus it would have to rebound back into the pennant to fill the open gap created this morning. I'm not a gold bug by any means - I don't own any at the moment - although buying some for a quick trade to fill that gap is on my radar. I just like to watch how common T/A patterns play out.

032316a.gif
 
The Trannies have fallen below the 200-day EMA this morning, and below the rising support line. The 50-day EMA needs to hold otherwise there's not much support below.

040616a.gif
 
Trannies struggling to get back above the 200-day EMA after rebounding off the 50 EMA. Where it closes could be key.

040816a.gif
 
Back
Top