tsptalk's Market Talk

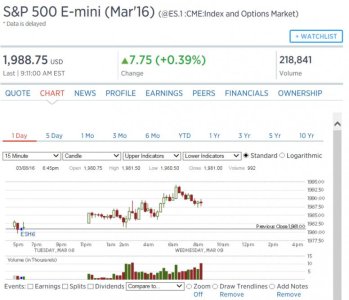
The 15-minute futures chart shows some possible resistance in this area, after 7 consecutive positive 15-min bars. The S&P 500 is currently 1992.

030816a.gif
 
The 15-minute futures chart shows some possible resistance in this area, after 7 consecutive positive 15-min bars. The S&P 500 is currently 1992.

030816a.gif

Thanks for the channel depiction. T

he other resistance is in the 199000 in the horizontal, where several other places in the chart either ran on top of or hit before going in a different direction. Breaking the channel can lead to the break going vertical. Not breaking the channel (failing the test of the channel's upper bounds) is supported with the overall trend - downward.
 
As the world digests Draghi's comments, it's interesting that London's FTSE is now down while Germany and France's markets remain up 1%.

"The bank's president, Mario Draghi, said the outlook for economic growth in the euro zone had been revised slightly down, mainly reflecting the weakened outlook for the world economy but added that he did not anticipate the need to reduce rates further, but new facts could change the situation.

"In light of cuts to the growth and inflation outlook, the ECB announced on Thursday that it had cut its main refinancing rate to 0.0 percent and its deposit rate to minus-0.4 percent."

http://www.cnbc.com/2016/03/10/will-super-mario-deliver-high-hopes-for-robust-ecb-easing.html


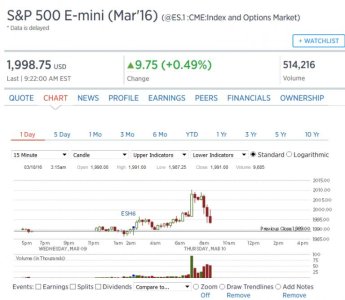
The U.S. futures lost a lot of steam since the announcement a couple of hours ago.

(5-min bar chart)
031016a.gif
 
Yep... and of course I heard futures were shooting up and market would open in triple digits this morning. I guess that was BEFORE the meal was fully digested. :sick:
As the world digests Draghi's comments, it's interesting that London's FTSE is now down while Germany and France's markets remain up 1%.

"The bank's president, Mario Draghi, said the outlook for economic growth in the euro zone had been revised slightly down, mainly reflecting the weakened outlook for the world economy but added that he did not anticipate the need to reduce rates further, but new facts could change the situation.

"In light of cuts to the growth and inflation outlook, the ECB announced on Thursday that it had cut its main refinancing rate to 0.0 percent and its deposit rate to minus-0.4 percent."

http://www.cnbc.com/2016/03/10/will-super-mario-deliver-high-hopes-for-robust-ecb-easing.html


The U.S. futures lost a lot of steam since the announcement a couple of hours ago.

(5-min bar chart)
031016a.gif
 
The F fund is pissing me off, shouldn't it be up on a day like today?

Not if, as Fred Sanford used to say, "this is the big one!" :)

For whatever reasons, correlations occasionally flip-flop. F fund vs C/S/I funds. Gold vs Dollar. Etc. :blink:
 
The F fund is pissing me off, shouldn't it be up on a day like today?

Not if, as Fred Sanford used to say, "this is the big one!" :)

For whatever reasons, correlations occasionally flip-flop. F fund vs C/S/I funds. Gold vs Dollar. Etc. :blink:

I'm glad you brought this topic up, it has always been of interest to me.

Back when I first started here, I had manually counted how often the F-Fund traded in the same direction as the C-Fund, it was about 33% of the time. This was before I knew how to do anything in excel, so it was a very primitive calculation.

In 2015, over 254 days

SPX/W4500 traded in the same direction 87% of the time.

SPX/AGG traded in the same direction 19% of the time.

That's probably a fair estimate of the overall performance across most years.
 
There is a large gap there that may need to get filled, but this looks like a significant breakout for the high yield bonds, after several prior breaks above other resistance. This may be a very bullish indicator for stocks. We'll see how it survives the Fed next week.

031116b.gif
 
I hope Birchtree is watching from afar in his retirement. He lived for this type of action - irrational exuberance. :nuts:
 
I don't know exactly how closely this End Of Day daily chart of WTI Oil corresponds with the open active futures prices, but I see crude futures trading below $37 right now. A possible break down of the rising channel if it holds. A healthy pullback would find support at the 50-day EMA, but how will stocks react?

031416a.gif
 
I think oil will test the 35.50 level and stay in a range of $35 to $40. If it does then I think the market will go higher into mid-April. This would coincide with the election chart that was posted. I've had pretty good luck following the chart over the last month. We will have a clear direction soon.
 
Back
Top