sniper's Account Talk

Here's some updated charts with my thoughts..

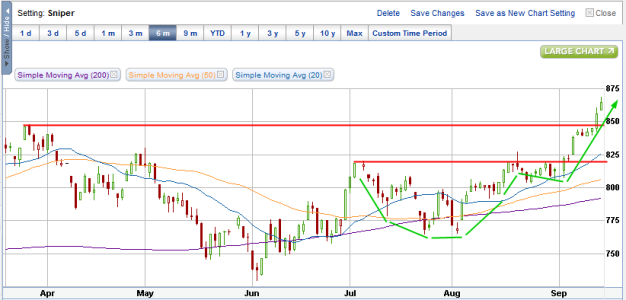
First chart I checked was the Russell 2000, showing the cup and handle breakout. The breakout stalled at the previous 6-month high for a few days before shattering it, thanks to QE3. Momentum may still carry it up for a few more days, but I'm expecting a test of that 849 level soon. Due to the depth of the cup & handle, the price target should be around the neighborhood of 870-880 before a pullback to test the resistance.
9-15 RUT.png

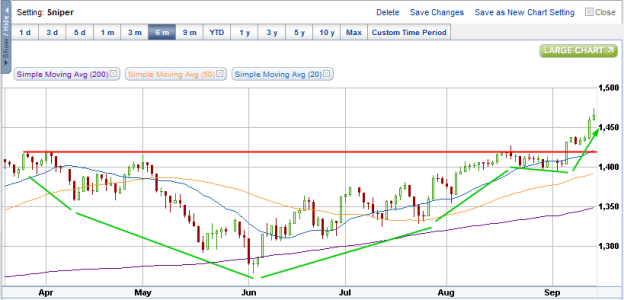
The S&P is probably the most interesting chart to me, it looks like a longer-term cup & handle formed and is breaking out. The depth of this cup implies that a (by a technical standpoint) that the price target could be somewhere around 1600? Granted that this was a longer-term pattern, this upward trend will probably take longer to reach it's target. The last trading day is showing a shooting star, this one may pull back a little to test the breakout or take a breather.
9-15 SPX.png

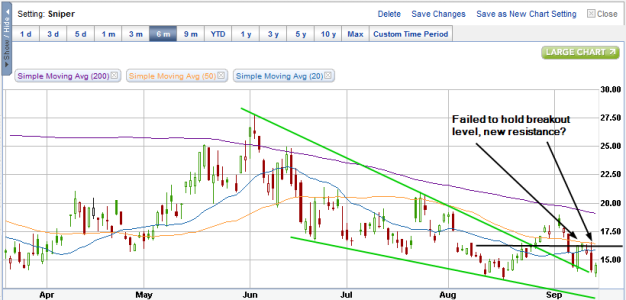
The VIX isn't looking so hot, which is great news for the S&P. Going back to its breakout of the downward wedge, it went on to test its breakout resistance point and failed.
9-15 VIX.png

Looks like a bullish market for the time being, but I really wonder what the implications of QE are going to be in the long run. are they creating a bubble? well I plan to get on for the ride and try to get out before it pops if this is the case :) For now though, these moves have been done on high volume, so I don't see a reversal of this trend being likely in the short term. Maybe some healthy pullbacks, but the uptrend is here to stay barring some crap hitting the fan, imo
 
looks like markets are pulling back to test breakout levels. At the test line I'm a buyer again.

If I was already in the C/S fund, I'd stay there (getting a hold signal as long as b/o level isn't broken), but since I'm not, I'm looking for a better buying opportunity.

Bought some TZA which I plan to dump in a few days. Just looking to make a quick percent or two before the next upswing
 
shooting star confirmed with red today, a move down over the next couple days is my guess. Nothing to worry about, this kind of upward swing was due for a breather.

keeping my eye on these levels: RUT (849), SPX (1420).
 
Russell 2000 close enough to my 849 target, going back on a buy (having to factor in the damned 1 day delay the tsp has).

put tight stop losses on my TZA, locking in 3%. Will wait for a positive reversal signal before jumping back into TNA
 
Russell 2000 close enough to my 849 target, going back on a buy (having to factor in the damned 1 day delay the tsp has).

put tight stop losses on my TZA, locking in 3%. Will wait for a positive reversal signal before jumping back into TNA

How'd you get 3% from yesterday until today?
 
looks like markets are pulling back to test breakout levels. At the test line I'm a buyer again.

If I was already in the C/S fund, I'd stay there (getting a hold signal as long as b/o level isn't broken), but since I'm not, I'm looking for a better buying opportunity.

Bought some TZA which I plan to dump in a few days. Just looking to make a quick percent or two before the next upswing

got in on friday EOD, it's more like a high 2% but ah, close enough :)

Gotcha, I just saw your Monday post, so I assumed you got in on Monday. Congrats, I didn't get in that good so I am stuck for now unless I see we are heading up and then I will dump for yet another loss...
 
Gotcha, I just saw your Monday post, so I assumed you got in on Monday. Congrats, I didn't get in that good so I am stuck for now unless I see we are heading up and then I will dump for yet another loss...

put in the order at 2 minutes before close when i saw shooting stars forming on most of the charts and thought i'd roll the dice, got lucky :) you in TZA also? I'm thinking tomorrow is another down day before the next up move. I'm looking at the 849 pivot point on RUT, a bounce up there would mean off to the races again
 
put in the order at 2 minutes before close when i saw shooting stars forming on most of the charts and thought i'd roll the dice, got lucky :) you in TZA also? I'm thinking tomorrow is another down day before the next up move. I'm looking at the 849 pivot point on RUT, a bounce up there would mean off to the races again

I am, but I am not counting on the anything but up right now. I just thought I would take advantage of the pull back from QE3 announcement, just got in too late. I think the bears are hibernating...
 
Taking a Little bit of Risk

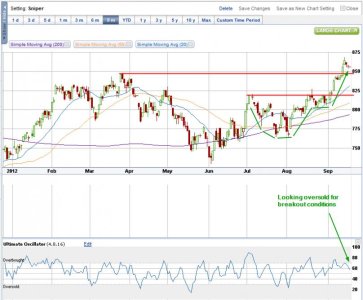
Here's a little bit of what I'm seeing and my decision to jump back into S fund. Here's the latest Russell 2000 chart, and it's looking like it's priming up for a move. Up or down? We're in a strong uptrend, so why not up? :) The depth of our cup and handle breakout in early September gave me a price target of 880, which hasn't been reached yet. Long-term resistance at 849 was breached, so I'm looking at that as the new resistance. I may have gotten in a little early (was expecting a sharper pullback to 849), and may take a little loss before the next upswing, but risking 1% for a greater return sounds good to me. The oscillator is below 60 which is bullish for a breakout condition in my book. Generally breakouts tend to hug the oversold condition for a while. Investors are still a little tentative because of seasonality perhaps?

9-19 RUT.jpg

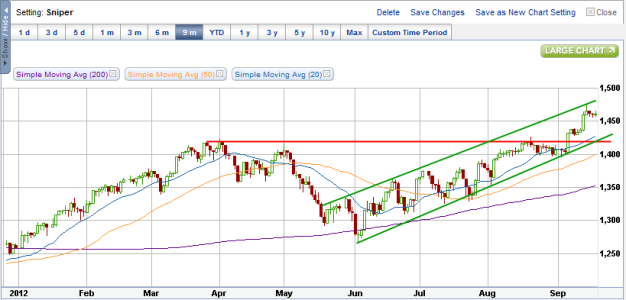
The S&P is showing its continuation of a nice uptrend. I purposefully left out the 6-month cup and handle formation just to look at the overall trend channels. After a long 1-month consolidation period (basically all of August), it smashed the long-term resistance of 1420 and has continued climbing upward since.

9-19 SPX 2.png

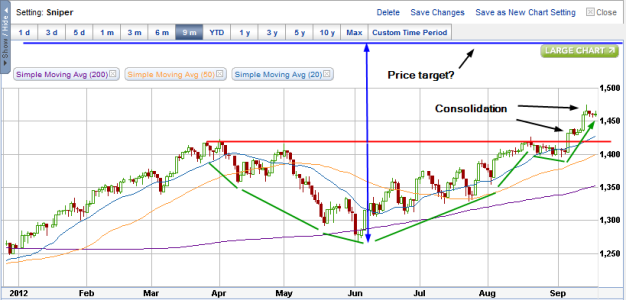
Now I'll have a 'BirchTree' moment :) Once again, pointing out a 6-month cup and handle breakout. Tech Analysis usually says the price target of such a breakout is the depth of the pattern, but this literally looks, well, off the charts? Crazy huh? Let's see where this market takes us ;)

9-19 SPX.png
 
When did you put in your IFT? Mine was effective COB yesterday, so I'm up to my neck in doo-doo it looks like. I hope, for your sake, that yours doesn't go through until the end of today. :(
 
When did you put in your IFT? Mine was effective COB yesterday, so I'm up to my neck in doo-doo it looks like. I hope, for your sake, that yours doesn't go through until the end of today. :(

Mine went through the same time yours did. I'm not worried, I expected a little more of a pullback to test 849, and it looks like it did that this morning and is holding so far. I'm keeping my position as long as that level holds.
 
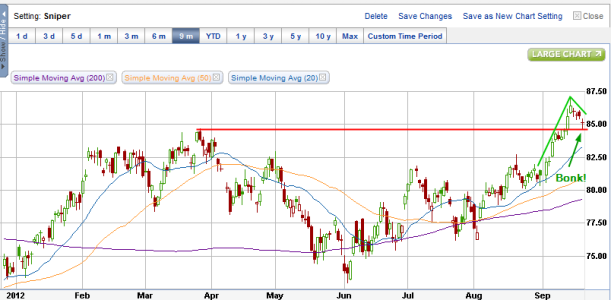
Looks like a bounce off 84.9 and a nice bull flag formed (Russell 2000 - IWM chart). Took a bite of IWM @ 85.01

rut9-20.png
 
Can't say I'm too pleased with the intraday activity in the Russell 2000 (high of over +.8% but closed at +.36%), but a gain is a gain, and it did enough to break out of the bull flag pattern and hold. Next week will be interesting.
 
Aggressive dip buying intraday, IWM just went in the green after coming within 2 cents of my stop loss point. Why didn't I buy TNA like I usually do? lol.
 
Back
Top