-
The Forum works well on MOBILE devices without an app: Just go to: https://forum.tsptalk.com
-
Please read our AutoTracker policy on the IFT deadline and remaining active. Thanks!
-
$ - Premium Service Content (Info) | AutoTracker Monthly Winners | Is Gmail et al, Blocking Our emails?
Find us on: Facebook & X | Posting Copyrighted Material
-
Join the TSP Talk AutoTracker: How to Get Started | Login | Main AutoTracker Page
You are using an out of date browser. It may not display this or other websites correctly.
You should upgrade or use an alternative browser.
You should upgrade or use an alternative browser.
sniper's Account Talk
- Thread starter wavecoder
- Start date
wavecoder
TSP Pro
- Reaction score
- 24
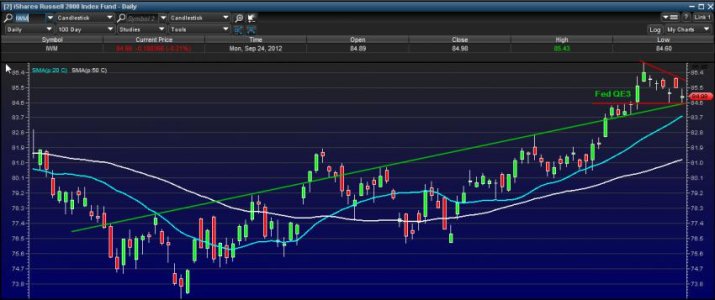
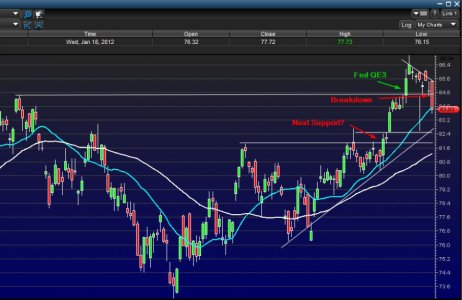
My stop loss at 84.58 got dangerously close to being hit today, and it might trigger tomorrow... or might not
The pattern can be seen either 2 ways, a bullish continuation pattern or a possible descending triangle. the recent breakout seemed to cause a role reversal over the 80 day (approximately) resistance line. I'm staying bullish as long as it can continue to stay above that, but if it fails to hold above the opening day of QE3, I'm treating this like a failed breakout. This week seems like a do or die week for small caps.
wavecoder
TSP Pro
- Reaction score
- 24
damn bearish propoganda triggered my stop loss, but I have a feeling that news will be digested intraday and we close positive. will check back at EOD, the close is what matters anyway
gonna wait for the next buy opportunity for stocks, but for TSP looks like I'm stuck with S until tomorrow at earliest
gonna wait for the next buy opportunity for stocks, but for TSP looks like I'm stuck with S until tomorrow at earliest
wavecoder
TSP Pro
- Reaction score
- 24
Stocks taking a downturn intraday because Caterpillar announced reduced earning expectations for....2015?????
Wall Street drops after Caterpillar forecast, German data - Yahoo! Finance
This should be a dip that doesn't last long.
I don't trade based on the news, but whatever the case may be, this isn't looking like a good chart for the short term. if that QE3 open level doesn't hold we're looking at downside. descending triangle patterns always gives me the heebie jeebies, i've never won when betting against them.
edit: oops posted the TNA chart, but still probably looks a lot like the RUT chart since it follows the same stocks
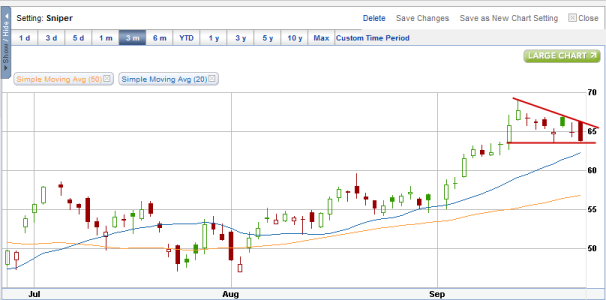
Took a position in TZA (14.41), this looks like small caps are breaking down out of that pattern
Last edited:
wavecoder
TSP Pro
- Reaction score
- 24
ouch, looks like thanks to the 1 day IFT delay I'll be lucky if I break even for this month (-1.2 - 1.5% in a day, that's gonna sting). Exiting S, it appears the breakdown for the Russell 2000 is holding strong. Next resistance looks to be 820.
can't win em all, lock and load for october!
I think I need to change my TSP strategy a little bit. My system has worked well in stocks/ETFs so far (+50% YTD), but the TSP account has only gained about 12%. To compensate for the IFT delay, I've been putting trades in way too early to try and beat the market, and while that's nailed a couple hits, it's a little too reckless. Need to work with the TSP restrictions, and I don't think I've done that effectively. It's back to the drawing board as I'm out of IFT's for the month around 12% for the year so far isn't the end of the world, but I honestly don't like the idea of losing to the S&P.
can't win em all, lock and load for october!
I think I need to change my TSP strategy a little bit. My system has worked well in stocks/ETFs so far (+50% YTD), but the TSP account has only gained about 12%. To compensate for the IFT delay, I've been putting trades in way too early to try and beat the market, and while that's nailed a couple hits, it's a little too reckless. Need to work with the TSP restrictions, and I don't think I've done that effectively. It's back to the drawing board as I'm out of IFT's for the month
Last edited:
wavecoder
TSP Pro
- Reaction score
- 24
Looks like our next support is around 820, where the original cup and handle breakout happened. Asia markets went down, European markets are following suit. Futures are up but I don't expect tomorrow to be another positive day, bears seem to have stepped in today in full force and I just hope it's not down too hard before my IFT goes through lol.

MaStA
TSP Analyst
- Reaction score
- 8
balls, at least TZA is scoring for me
At least I know I'm not the only one holding onto TZA still. There are so many systems going in opposite directions and I don't know which way to go...
I'm still down big time on my TZA so I really don't want to let it go, but there will be a point and time that I have to let it go and jump on the TNA bandwagon so I can make my money back. I think I bought my TZA at like 17.50 a while ago and I have road all these waves. It hurts...
Are you holding yours through tonight?
wavecoder
TSP Pro
- Reaction score
- 24
At least I know I'm not the only one holding onto TZA still. There are so many systems going in opposite directions and I don't know which way to go...
I'm still down big time on my TZA so I really don't want to let it go, but there will be a point and time that I have to let it go and jump on the TNA bandwagon so I can make my money back. I think I bought my TZA at like 17.50 a while ago and I have road all these waves. It hurts...
Are you holding yours through tonight?
yep, just advancing the stop loss to today's low (i usually do that whenever a stock/etf advances by 2.5% or higher). It might change if the Russell 2000 bounces back and shows a reversal flag but I don't think that's gonna happen, I do majority of my ETF trades in the last 10 minutes of the trading day.
My sell target for TZA is that box on the chart a couple posts down in the RUT's 820ish range
MaStA
TSP Analyst
- Reaction score
- 8
yep, just advancing the stop loss to today's low (i usually do that whenever a stock/etf advances by 2.5% or higher). It might change if the Russell 2000 bounces back and shows a reversal flag but I don't think that's gonna happen, I do majority of my ETF trades in the last 10 minutes of the trading day.
My sell target for TZA is that box on the chart a couple posts down in the RUT's 820ish range
Gotcha. Why does the chart have a decimal place in the numbers on the right? Seems like the chart's 82.0 is talking about your 820 number. I might just be confused too.
wavecoder
TSP Pro
- Reaction score
- 24
Gotcha. Why does the chart have a decimal place in the numbers on the right? Seems like the chart's 82.0 is talking about your 820 number. I might just be confused too.
ah, that's the IWM chart, it follows the Russell 2000. 82.0 would be around the 820 level for the RUT chart
for some reason, power e-trade pro doesn't let me look at index graphs, only stocks/etf's.
MaStA
TSP Analyst
- Reaction score
- 8
ah, that's the IWM chart, it follows the Russell 2000. 82.0 would be around the 820 level for the RUT chart
for some reason, power e-trade pro doesn't let me look at index graphs, only stocks/etf's.
Gotcha! I'm still learning that's for sure. I was watching a video last night that Bquat posted by a guy named Christian and he uses the Ultimate Oscillator to determine bottoms if I understood him correctly. You ever hear about people using that indicator?
wavecoder
TSP Pro
- Reaction score
- 24
Gotcha! I'm still learning that's for sure. I was watching a video last night that Bquat posted by a guy named Christian and he uses the Ultimate Oscillator to determine bottoms if I understood him correctly. You ever hear about people using that indicator?
I watch some of his videos, and the guy gives some good advice. Some people I noticed use ultimate oscillator, some use stochastics, both are good at showing if a stock/etf is in oversold/overbought territory. I don't really follow that indicator closely, but I still do use it to give me an idea of when a stock may be shifting direction soon (no stock stays oversold/overbought forever).
Following Christian might take some patience, some of his calls get stopped out, but setting the stop losses is important, better to lose 5% than losing a crapload if you're at the wrong end of a trade. He did hit some very nice trades recently though, and he updates every day. I more watch his videos (along with some others) to know opinions of some other good traders, sometimes I go against them if I'm seeing something else. Win & lose some
wavecoder
TSP Pro
- Reaction score
- 24
The Russell 2000 ran into some bears EOD, but fought hard to close over the 20 day SMA, looks bullish to me esp with the bounce off the lower trend line.
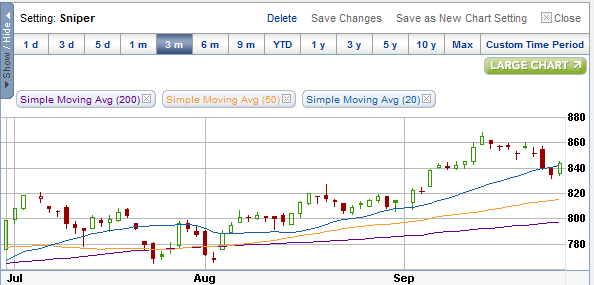
One thing I would really watch out for, is the recent 'smart money' move on Sep 21 was a huge sell/short move, and chances are some big players don't want the market to go above this point. I would start exercising caution when the Dow runs into the 13,600 mark.
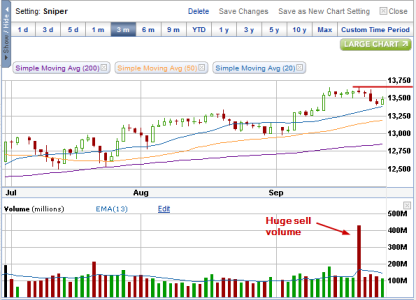

One thing I would really watch out for, is the recent 'smart money' move on Sep 21 was a huge sell/short move, and chances are some big players don't want the market to go above this point. I would start exercising caution when the Dow runs into the 13,600 mark.

RealMoneyIssues
TSP Legend
- Reaction score
- 101
- Mondays usually suck for the market (maybe why the selloff at the end, people are starting to fear monday)
And when you begin to expect it, the opposite will happen...
wavecoder
TSP Pro
- Reaction score
- 24
And when you begin to expect it, the opposite will happen...
pretty much lol. despite the market move up, I'd have to say it's highly disppointing. Something's fishy, SPX is outperforming RUT by 2/1. I was hoping to get a 4+% day on TNA, guess that's not happening
wavecoder
TSP Pro
- Reaction score
- 24
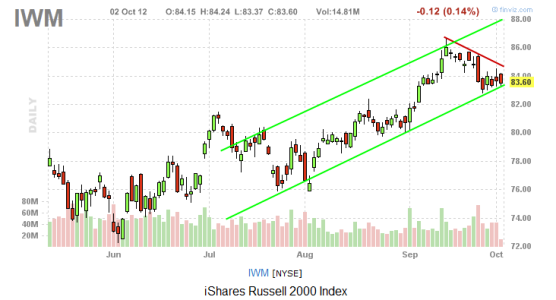
Here's what I'm seeing, despite the last few days of trading being a disappointment, we are still holding the current up channel and are still in an uptrend. We are coming to a point where rising support is running into lowering resistance, and something's gotta give. For the last 4 trading days, the lower support has been tested, and successfully. On the downside, it's still failing at the 20 day SMA. Probably won't be today, but I'm expecting a move soon.
There's a bear flag forming, which is something to look out for. If the support breaks, I'm not sure if I'd short the market at the moment, it is still looking rather oversold and I'd still be looking for a buy opportunity in the near future. Still watching from the sidelines in the G-fund but leaning bullish. Holding TNA but tightened my stop loss point in case this bear flag breaks to the downside.
There's a bear flag forming, which is something to look out for. If the support breaks, I'm not sure if I'd short the market at the moment, it is still looking rather oversold and I'd still be looking for a buy opportunity in the near future. Still watching from the sidelines in the G-fund but leaning bullish. Holding TNA but tightened my stop loss point in case this bear flag breaks to the downside.

Similar threads
- Replies
- 2
- Views
- 531
- Replies
- 0
- Views
- 566
- Replies
- 0
- Views
- 81
- Replies
- 1
- Views
- 751

