sniper's Account Talk

are you in or out? i'm 100G so looking for a crash. i hope you just called it in.

still on the fence right now, but starting to lean bearish. failing to hold above the 20day is telling me this could be a role reversal in the making (looking like resistance vs support)

will make a decision tomorrow before the IFT deadline, I don't know if I'll go 100G but a more defensive position (20S/10C/70G). I've got 27 years till retirement so I tend to always lean toward some risk :)


if i'm lucky i have 27 years till i'm dead. but i tend to favor risk as well. i got a late start and have some ground to cover yet.
 
if i'm lucky i have 27 years till i'm dead. but i tend to favor risk as well. i got a late start and have some ground to cover yet.

dang, well you seem to be doing very well on the autotracker for this year, I could probably learn a thing or 2 from you. cheers! :)

I'm still relatively new to this and trying to improve my craft. Hopefully at least by mid career I'll be as good as intrepid timer lol
 
dang, well you seem to be doing very well on the autotracker for this year, I could probably learn a thing or 2 from you. cheers!l

i would not recommend that strategery. i trade based almost solely on sentiment. when all the good charters are rubbing their hands together because we'll all be gauranteed profits or they start squawking chicken little, then i move the opposite way.

sometimes i get lucky.

cheers.
 
market's probably going to be flat and hover in the 13100-13200 range until friday. gonna hold the same position for now

bought some intel at 24.88, stop loss set at 24.49
 
i never understood how some days S fund has a nice return despite being the DOW being in the red. how does that work?
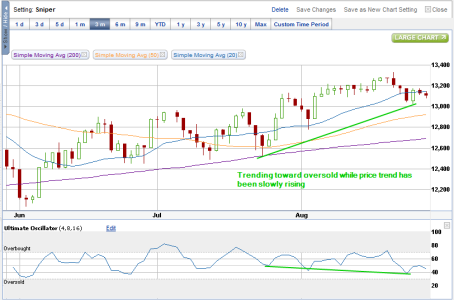
 
Oscillator moving more toward oversold while the trend is showing higher lows. A drift to the upside may be likely.

Doesn't seem like a wave of optimism is catching on early in the week leading to the fed report, so the likelihood of a major letdown is lessened. Going to hold my position into friday, so help me god :)

dow8-28.png
 
Ok good to know. From what I've read I always got the answer that the S fund followed the Dow, I guess that was incorrect :)

To add to RMI's response a little.. the S fund invests in Small and Mid Cap companies (Wilshire 4500 tracks this best I believe), while the C fund invests in the Large Caps. If I'm watching CNBC, I'll refer to the Russell 2000 for S, and the S&P for C. They aren't exact, but they display those often and they're close enough.
 
Thanks guys :) With that said, I just took a look at the Russell 2000 index and found a nice cup & handle forming on that graph.

closing above 820 could be a good buy opp

8-28 RUT cuphandle.png
 
hey sniper - there's something called the Dow Completion Index that this site used to use for following the S fund, but there were several occassions of it not matching up, so Tom switched to following the W4500.

By the way, you chart like a boss. Keep it up!
 
hey sniper - there's something called the Dow Completion Index that this site used to use for following the S fund, but there were several occassions of it not matching up, so Tom switched to following the W4500.

By the way, you chart like a boss. Keep it up!

thanks!

updated my IFT to lean more toward S fund since small caps are outperforming the S&P. Want to start off september in stocks (unless something forces me to retreat to G within 2 days) so I'll have a chance to retreat and get back in if a short-term buying opportunity presents itself.

90S 5C 2I 1 1 1 L funds
 
Aloha, Sniper

I'm a student at learning charts and was wondering what is the significance of a 'cup & handle' ?

Mahalo

Aloha!

The cup & handle is a bullish continuation pattern, where the chart forms a U shape (or cup for that matter), followed by a consolidation period of up to 1-2 weeks, usually slightly downward, forming the handle. What you get is a chart that looks like a coffee cup. The pattern is completed when the price moves upward again to test the resistance, and breakout is confirmed with a close over the resistance line. It's a good bullish indicator, so whenever you notice this type of pattern, it's a good time to add a stock/etf to your watchlist.

Sometimes it's better to wait it out for the breakout confirmation, depending on your risk tolerance

cheers :)
 
Breakout watch tomorrow for S fund, Russell 2000 Index (RUT) is within striking distance of 820 resistance line (scroll down if you haven't seen the cup & handle chart yet)
 
Back
Top