Dang! Now I am REALLY confused.
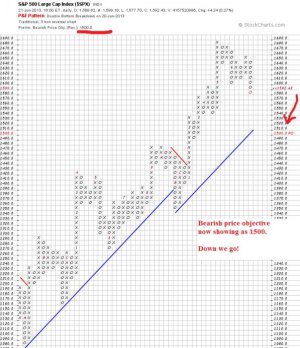
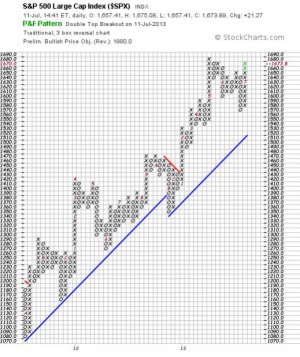
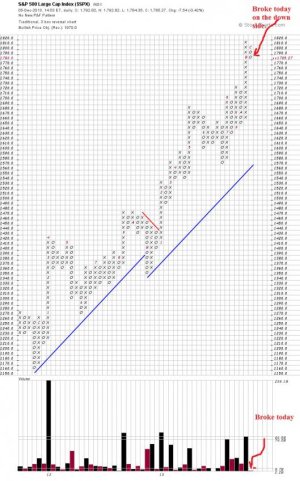
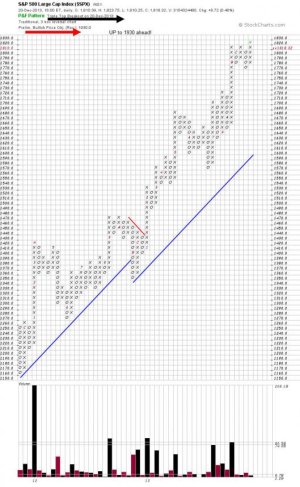
A few days ago I saw the "S" fund P&F chart break down and post a negative price objective, indicative of the market turning lower ahead.
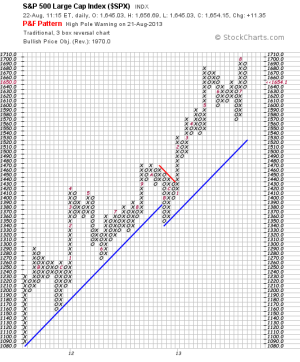
However, the S&P -500 chart had not yet turned, so I was waiting to see it go south before issuing a "SELL" signal on the P&F chart.
So now I am REALLY confused.
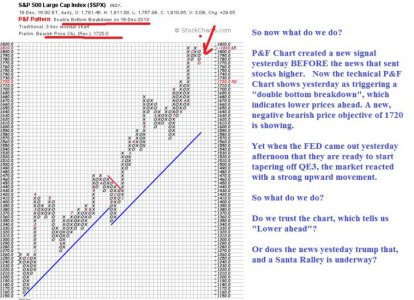
Yesterday, BEFORE the Fed annoucement of a taping of QE3, the market fell enough that the S&P-500 P&F Chart switched direction, registerd a new "double bottom breakdown", and a negative price objective was created. That's indicative of a lower stock market ahead. And sure enough, the P&F Chart created that signal yesterday!
 BUT:
BUT:
Since the FED made the announcement yesterday that they are going to start easing off the pouring in of liquidity, that announcement resonnonated across all the markets yesterday, and everything shot higher.
So......are we about to get a downturn, as the CHART indicates?
-OR-
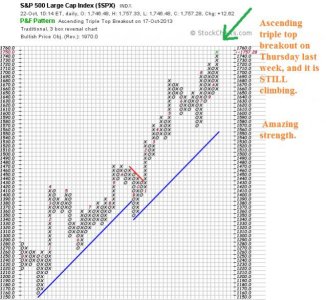
Did the FED announcement provide enough of an incentive that we are about to get our Santa Rally after all?
Ho Ho Ho...

(Sigh- if this was easy, we'd all be rich, wouldn't we?)

