P&F Chart School

This thing has huge legs and may grind up for a long while.

TTB = triple top breakout I presume. We are currently in what is often the most bullish of all the patterns, a 3rd of a 3rd of a 3rd. It's uncharted territory from here on out with no overhead resistance. Are we in the start of another melt-up that will carry into 2014.
 
Getting excited about the stock market doesn't mean much unless they put their chips on the line. This market continues to follow the 1995 breakout trajectory and can run and run.
 
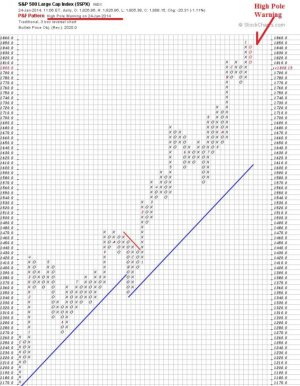
Just a note- the S&P 500 P & F chart signaled a "High Pole Warning" this morning.

An indicator of possible lower ahead.

It has not yet been enough to signal a formal reversal in price objective- so we will just be watching this much closer today and the next several days in case it does.

1-24-2014=HPW-SharpChartv05.jpg

I also note that the "S" fund chart is doing the same thing- a high-pole warning. The "I" fund chart has not yet flipped to that, however.

Anyway- now is a good time to pay close attention and see where things are going. Stay alert here.

Good luck.
 
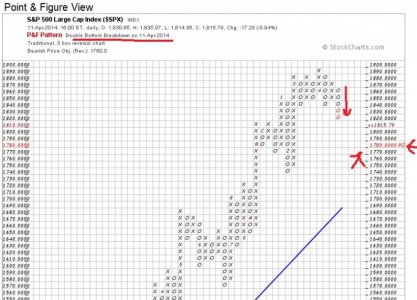
We currently have 5 Os down, on a 3-box chart shouldn't this have put in a reversal?

I am not sure- I have to go study my notes. I am thinking that we'll see the reversal show up after the market closes. It really doesn't matter to us now until noon cutoff tomorrow anyway.

I would note that Tom posted a real nice chart comparing this 2013-2014 run up to the 1929 stock market.


I'll have to go dig that up.

:-)
 
Yep- looking ugly. Double bottom breakdown and a negative price objective showing at 1640.

That parallel to 1929 is eerie, isn't it?
 
(crosses fingers AND toes- took a hit over the last three months and wants to be all better, and back where we were in January.)
 
Think I found it:
SharpChartv05.ServletDriver
 
Think I found it:

Yes, the chart went on the upside back on May 27th, with a forecasted Bullish Price Objective showing of 2040. Whether or not we make it to 2040 - well, I personally think that is doubtful on this cycle, BUT- we now have eleven positive "X"s showing, and I am thinking that because we are so close to the 2000 mark, that we MAY just swing up through that shortly.

But then again-.. well, who knows.

Ride it for what it's worth!


Happy Fourth of July!

http://upload.wikimedia.org/wikipedia/commons/c/cd/Animated_Fireworks.gif
 
Oh crap:

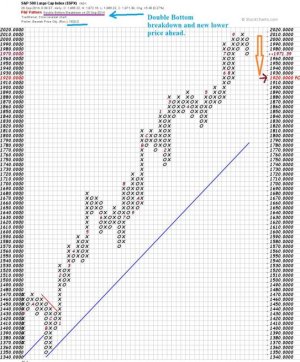
It looks like the P&F chart for the S&P-500 changed last night and I didn't see it until just now.

According to the chart, we just got a bearish "Double Bottom Breakdown" yesterday, and that changed the expectation to a new, lower number- back down to 1920 as the preliminary number.

Here is the chart:

big-P&F-09-26-2014.jpg

This would indicate a SELL signal in the S&P-500 (C fund) under the P&F Fund C method.


Now, I will tell you that for my own personal funds, I have been following a different system, but with THIS indicator, I am thrown for a loss at what I should do. As "The Clash" would say......SHould I stay or should I go?


Not sure what I am going to do personally yet. Maybe I will take a deep breath and flip a coin before noon today.

Good luck-


As always- this is not advice, this is nothing more than a technical report- and YOU are expected to make your OWN decisions about what is best for YOU.

Mileage may vary.

Good luck.
 
Back
Top