James48843
TSP Talk Royalty
- Reaction score
- 905
That double-bottom breakdown and sell signal in the P&F chart back on September 26 appears to be pretty significantly consistent.
It looks good today, at least.
And we have had some adjustments in the bearish targets as well in the last week or so.
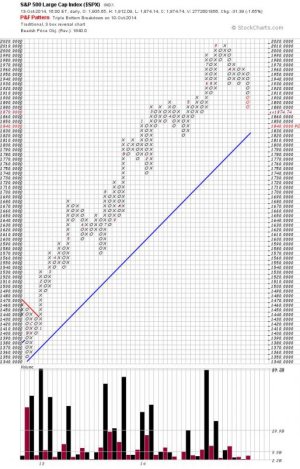
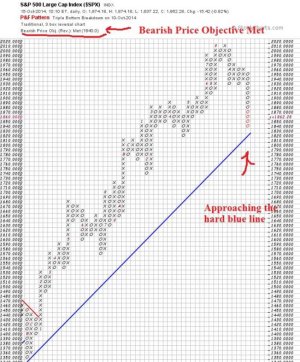
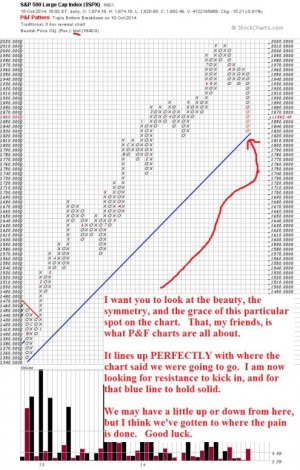
Now the bearish price objective - meaning the place at which the chart is predicting we'll find solid ground again, is now down to 1840. What that means is the P&F chart is saying we still have a ways downward to go.
Here is this morning's data:
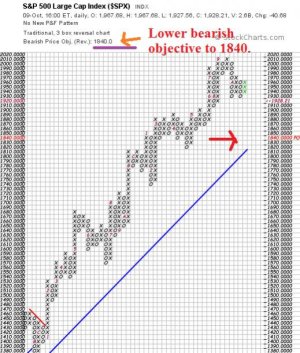
Not sure exactly where we go from here- but the P&F Chart for the S&P 500 is telling us to stay on the sidelines for a while longer.
Your mileage may vary. This is not advice- this is only charting. You decide what you want to do. Don't listen to me.
Have a great day, and good luck.
It looks good today, at least.
And we have had some adjustments in the bearish targets as well in the last week or so.
Now the bearish price objective - meaning the place at which the chart is predicting we'll find solid ground again, is now down to 1840. What that means is the P&F chart is saying we still have a ways downward to go.
Here is this morning's data:

Not sure exactly where we go from here- but the P&F Chart for the S&P 500 is telling us to stay on the sidelines for a while longer.
Your mileage may vary. This is not advice- this is only charting. You decide what you want to do. Don't listen to me.
Have a great day, and good luck.

