P&F Chart School

I am personally moving to "S" today. This is what I see in the S fund chart.

S_05-04-2012.jpg

And this is what I see in the C fund chart.

C_chart-05-04-12.jpg

Both indicate to me a better chance of higher ahead in the next week. So Ill run with it.

More later. Gotta go try the IFT now.
 
Well, we got a triple-bottom breakdown today, and that made a new
"bearish price objective", a change in the forecasted direction.

The new preliminary forecast is for a bearish 1280 price objective ahead.

On that, we'll officially move an IFT for the first time this year, and jump out to the safety of "G".

P&F Chart C officially IFT's to "G" effective close of business tomorrow.
pf-move-05-08-12.jpg
Good luck.
 
FYI- The "S" fuind is painting one UGLY P&F chart today. It just blew past support levels, and is now showing a significantly lower bearish price objective.

Here is the "S" chart:

ugly.jpg

Here is what the "C" fund is doing..... also looking nasty:

yuk2.jpg
 
Very interesting...

SharpChartv05.png

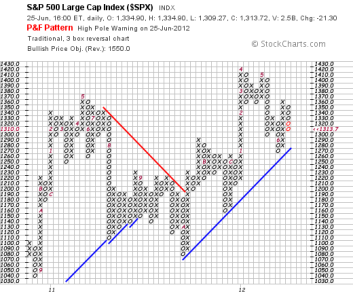
I admit I haven't been paying attention to the P&F chart lately. A high pole warning was issued today, so lower prices may be coming in the near future, but the price objective is 1550. I was staying away until it got close to 1180, where the price objective was at the beginning of the month. I might need to rethink this and use my IFT's before the end of the month to be back into the market for a bit.
 
Just an FYI-

The "S" funds' s P&F chart hit a reversal yesterday on the shortest term indicator- the first time in quite some time.

The "C" fund P&F chart may do the same this morning. I will be watching it closely now that we are near the mark where a reversal is possible.


Have a great day.
 
Just an FYI-

Both the "C" fund (S&P 500) and the "S" fund ($emw) P&F charts are showing positive signs today- indicating to me about 4 or 5 more very postive days ahead.

I'll try and post some technical comments tonight from home. Just wanted to say that I am seeing postive stuff on them right now- and a continued wave up for at least a little while. We'll see how it works out. Good luck.
 
Dang! I apologize but I missed a signal earlier this week for the P&F Chart for the S&P 500.

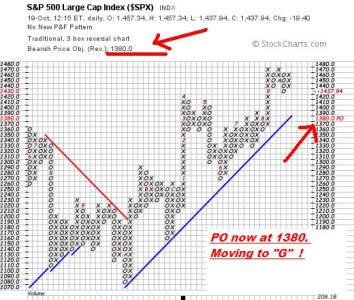
The chart moved to a REVERSAL- with a negative price objective (P.O.) of 1380! I am not exactly sure when it did it, but it appears to have switched a couple of days ago and I didn't look at it until a few minutes ago. I am therefore pulling the P&F chart trigger and moving to "G" as soon as possible. Unfortunately, it is after 12:00, so I am stuck till Monday.

Here is the P&F chart.
10-19-12.JPG

Moving to "G" on the P&F Chart C auto tracker account effective close of business Monday.
 
Getting Ugly.

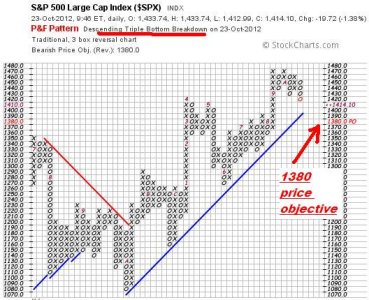
P&F chart now showing a triple-bottom breakdown today, with a renewed emphasis on the price objective of 1380.

This is the S&P 500 chart- but the "S" fund chart is doing the same thing- triple bottom breakdown and an ugly prediction.

Will the S&P 500 dip below the blue line, and reach down to 1380? Well, that's what the chart is saying will happen. I don't know for sure.


10-23-12.JPG
What I DO know is that I was able to bail out yesterday in the hypothetical P&F account. And I bailed out last week with my REAL money. In both cases, we're better off today than we would have been in a "buy and hold" situation.

Staying on the sidelines and protecting / preserving capital. Watching. And learning.

You always learn something new.

Good luck.
 
OK- Well, this morning, the P&F Chart hit it's BEARISH PRICE OBJECTIVE of 1380, which was predicted back on October 19th.

THIS MORNING's LOW WAS 1373.

The one thing I'll say about the P&F system is that there are many times when it is correct. Yes, it misses every now and then, but it hits a lot too, and is helpful to me as ONE FACTOR- but only one factor, that I use myself in making decisions.

Normally, reaching a price objetive is not the final word on when to change positions. It is quite common that sometimes a direction goes PAST a price objective (either up or down) and keeps going for a little while more. I am not sure if we are now done with the decline since Oct 19th as of today, or if we may keep drifting down a little lower. It could be either answer. So, today, I'm going to hold off for another day or two to see where it takes us. If we are at a bottom, we'll still be able to buy back in near here. If not, we can learn that too.

Here is the chart today:
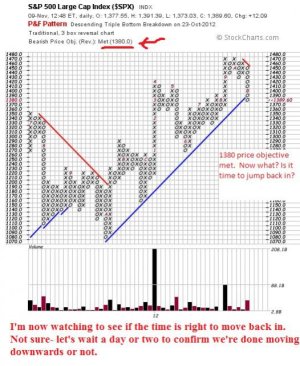
11-09-12-met-.jpg

We've met the forecasted 1380 S&P 500 bearish price objective, which was signaled back on October 19th. And we've done it in just about three weeks. Interesting.

Are we done now?

I'm not sure.

I'll wait another day and see how things look, before deciding whether to jump back in or not.

Today's S&P500- met bearish price objective, and now I am looking for a re-entry point.

Maybe tomorrow, maybe not. Let's see how today and tomorrow morning shake out.

Take care out there!
 
James, in reference to 1380. On the PnF Weekly, Daily, and 30 minute timeframes, 1380 is the Price Objective (providing confirmation.) In addition, 1380 is roughly a 50% retracement off the June bottom and a 25% retracement off the October 2011 bottom (providing confirmation.)

View attachment 21064
 
James: I wish you luck for your S fund (20%) and the I fund (80%. But I would like to see the the S fund with the larger gain. Look I'm only up 2.64% for the year. You, you are way up there on the tracker among the winners.

Someone please remind me to go wit one of the premium guys next year.
 
Just a comment tonight- none of the three I am tracking- C, S or I have reversed enough to change into a bullish price objective. So I am still holding my powder dry in this case with the S&P P&F TSPTALK mock account. I was tempted to move back in, but we're not clear yet if we are going to get a real reversal, or if that was just a bounce for a day or two. Even it it is real, the numbers are looking like up to only the 1430 or 1440 range on this cycle up. It's very early to get a flavor for where we go next. So will sit on the sidelines a little longer. Have fun. The S&P low was 1343, to anyone keeping track. We're now back up to 1386, just a hair over the 200 day moving average. I think we'll cycle up here to 1430 to 1440, may 1445, then break down again. We'll see. Take care and be careful out there- and remember- don;'t do what I do- do what YOU think you should do. Which, in some cases, is exactly opposite of me. :-)
 
For months now Tom has been talking about the range bound Transportation Index, nothing illustrates that better than a P&F chart. While the most recent range has definitely been broken we are now at a yet higher range we have not broken since July 2011. In years past the Transports have done a great job leading the markets, this year IMHO they did not lead the market at all, instead it was all lead by... Apple who lead the large caps and NASDAQ, so essentially what I'm saying is that this year was fake, a fraud perpetrated to have us believe we were in a bull market. The point I'm making is that if you can change the weighting of a stock, than you can alter the performance of the indexes, and that is what we've done with Apple.

The truth is is doesn't matter what I think, what matters is that we make money on what the market does, not what we believe it should do. If I traded solely on my beliefs, I'd be dead broke :D

View attachment 21690
 
Back
Top