P&F Chart School

After years of studying every technical chart indicator I can get my hands on, I still think that I get more pertinent information from P&F than from any other single source. Thanks to you and to JTH for keeping us up to date!
 
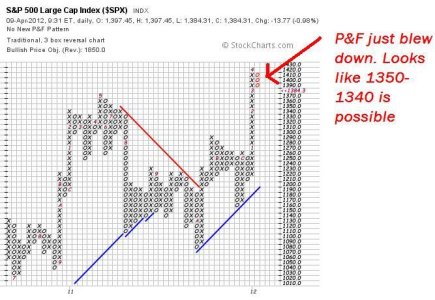
Watch P&F today very closely, we are within "smidgin's" of a downside break on the P&F chart, which would be the first downside in over four months, IF it breaks through.

Today may be the day it breaks.

After years of studying every technical chart indicator I can get my hands on, I still think that I get more pertinent information from P&F than from any other single source. Thanks to you and to JTH for keeping us up to date!

Well it was one of those "Missed it by this much" days, the S&P 500 was less than 3 points from putting in a reversal, many others stood their ground...

View attachment 18492
 
Watch the P&F closely on monday- I think we'll finally get the break down that has been hinted at but not triggered for weeks.

Kevin just posted the big slide down in the overnight futures market- and Japan went down tonight with a loss of over 1%, sparking selling in other Asian markets too. If it carries through into European markets tonight, we should see a hit tomorrow in the US markets.
 
shucks- European markets closed for Easter today.

We'll just have to wait and see how much damage there is when the US markets open this morning.
 
After years of studying every technical chart indicator I can get my hands on, I still think that I get more pertinent information from P&F than from any other single source. Thanks to you and to JTH for keeping us up to date!

Wow! That says a LOT! I like P&F too, but have only looked at the charts with an interesting curiosity, rather than as a timing mechanism. Maybe I need to learn how to read them better.

Thanks to all three of you!

JR
 
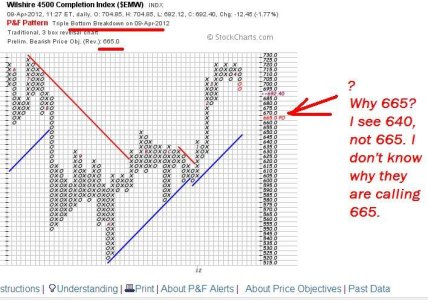
That is weird. I am looking at that same "S" fund chart, ($emw), and it is saying to me, that the resistance is at 640, not 665. The only thing at 665 is a hypothetical green line slope (green on your JTH, blue on mine) on the upward climb. That isn't enough in my mind to stop a free-falling indicator- and I am thinking it won't be until 640, not 665.

1-S-reversal-04-09-2012.JPG

Interesting.

well, here is my call: The mathmatical formulas say 665, according to this P&F chart. My gut tells me 640, not 665.

But I'll stick with the P&F mystical math, and watch carefully for 665, and if and when it reaches that, I'll consider that time to buy back in.

Cross my fingers and let's see what the P&F spirits do next. :-)
 
How are you getting 640, are you using the lateral or horizontal formula?

Formula? Oh jeeze, I knew I forgot something.


I'm just looking at it with a Mark 1 eyeball and guessing. :)


Laterally, there are at least three times in the 640 area to the left, and that gives me lateral comfort of a resistance point there. With just a Mark 1 eyeball.
 
For the vertical account I have 5 x 2 x 5 = 50 (715 - 50 = PO of 665)

For the Horizontal count I have 6 x 3 x 5 = 90 (715 - 90 = PO of 625 also a double bottom)
 
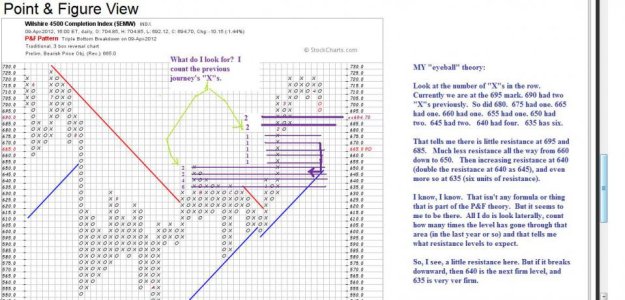
Here is what I am looking at, and seeing, in the "S" fund chart:

I am looking at the number of "X"s that we previously traveled through. If there is only a single one, that is 'light resistance" to me. If we have more than that, then I expect more resistance. Does that make sense? I know it's not how you are supposed to use P&F charts- but it seems to have some value to me.

Take a look at the purple line I marked here:

SIX.jpg

I see a little light resistance here. then less resistance lower, until we hit big resistance again at the 640 to 635 level.

That's just my 2 cents. I think we also could get some reversal here as a buying opportunity, depending on whether or not money floods back in tomorrow at the level here.
 
I see where you are coming from, it sort of reminds me of a "price by volume" method. By this methodology I would hypothesize that 635 would be the most solid of support lines we could expect a bounce from?
 
Yes- but I don't think we'll go that low. I still think 650-645 will be a bounce back. IF we even go that far down. I'm not convinced yet. Let's see what happens in the next day or two.

We'll just have to wait and see.
 
Yes- but I don't think we'll go that low. I still think 650-645 will be a bounce back. IF we even go that far down. I'm not convinced yet. Let's see what happens in the next day or two.

We'll just have to wait and see.

I'm glad you don't think we'll go that low (just yet.) I just finihsed a PnF on the F-Fund share price over the weekend, I'm pretty sure we'll see a bullish reversal (based off a .02 box size) today, I'll post it this evening. I miss having my paid stockcharts.com account, they had different timeframes for the Pnf charts which really brought out some interesting perpectives. I may have to re-up again...
 
Today the F-Fund closed within an area of key resistance at 15.48 What we have is rising Os from the bottom supported by a twice-tested rising green trendline. Combine this with a flat red top of Xs at 15.48-15.50 and it appears there is rising pressure to the upside indicative of an upside breakout. Anything can happen, this is just my interpretation.

View attachment 18518
 
Finally, somebody provides comments on interpreting P&F I can wrap my brain around. but its my own fault, I confess I haven't put any study time into these, I just look at them and they look like a Rohrshach blot to me, can't make heads nor tails out of them, not intuitive at all for me and so I've steered my TA interests in other directions.

Incidentally, S has completed 9 up on weekly DeMarks, heading into next 13, which can reach their goal through any combination of sideways/up from here for as long as it takes to get to the next big 4week DeMark flip downwards. Support for the 9-up on weekly comes in at 630, btw.
 
Thanks JTH for interpretive commentary on P&F I can wrap my brain around. Its my own fault, I confess I haven't put any study time into these, I just look at them and they look like a Rohrshach blot to me, can't make heads nor tails out of them, not intuitive at all for me and so I've steered my TA interests in other directions.

Incidentally, S has completed 9 up on weekly DeMarks, heading into next 13, which can reach their goal through any combination of sideways/up from here for as long as it takes to get to the next big 4week DeMark flip downwards. Support for the 9-up on weekly comes in at 635, btw (looks like 630 when I eyeball it).
 
One of the members asked to explain a little more about P&F charts. I have commented about using P&F charts in my acocunt thread, and some people were asking me questions about my comments- so I figured I'd start a new thread to become P&F Chart School.

When James started this thread in late 2007, I knew little if anything about PnF. Thanks to him, I've grown to appreciate and expand my knowledge. :)
 
Back
Top