Nordic's Account Talk

reverse head and shoulders forming

If you take a look at most charts, you'll see a reverse head and shoulders pattern taking shape, with the right shoulder under construction possibly. We probably still need a bit more of a pullback to define the right shoulder better, but it might be a good buying opportunity as reverse head and shoulders usually result in a rally.
 
wave update

"Outlook hasn't changed. Minor 2 is probably the best count. But be on your toes, Minor 3 down is right around the corner."

Daneric's Elliott Waves

spx30.png
 
wave count

There may be a brief uptick comprised of a small wave 2 up, but then this sucker should continue on it's Minor 3 journey down. The current wave count is holding up pretty well so far. I'll be in G Fund until at least next week.

"Today made a lower low which makes 5 waves down since the recent 1364 peak. The primary count is Minor 3 down."
 
"the great maybe"

"Morse said he expects “some shockeroo” between now and Election Day – most likely stemming from Europe – that will begin to show what the long-term international economic picture will look like, he believes “much of that is already in the marketplace.”
As a result, Morse’s “great maybe” plays in what he sees the potential for the Standard & Poor’s 500 index /quotes/zigman/3870025SPX+1.65% could decline by 10% or more between now and year’s end, “there’s an equally reasonable chance the year could end with modest single digits on the upside.”

Market on the edge of 'the great maybe' - The Tell - MarketWatch


Nice gain today, but the Eurozone puppet master is still pulling our strings. Where do we go from here? Your guess is as good as mine...mixed signals and indicators everywhere you look. Head and shoulders here, QE3 there. Roll of the dice...
 
This article is for you Birch. I'm staying in over the weekend, one of these Mondays have to be positive...statistics say so. I'd like to go into August invested before possibly visiting the sidelines again.

“When the trading really comes back in September and the campaigning really gets going for the election, I think that [the S&P] is going to be forced up,” Leydon said, “and I wouldn’t be surprised to to see us up to 1,550 … by the election.”

S&P 500 could hit 1,550 by election says Financial Focus's Leydon - The Tell - MarketWatch
 
Don't let your guard down

"Because Elliott analysts know that during a market downtrend, second waves can convince investors that the rally is a new bull market.
That can be a financially dangerous mind-set.
Optimism precedes third waves lower. Then, seemingly out of nowhere, a third wave can commence with unrelenting violence and speed.
In the chart above, you saw the optimism-driven rebound just before prices plunged.
Do not expect the financial media to provide you with advance warning of a third wave. The crowd is almost always on the wrong side of the market. Third waves arrive unannounced."

The Drop Like a Rock Scenario for U.S. Markets | Elliott Wave International | Safehaven.com
 
Re: Ego trading

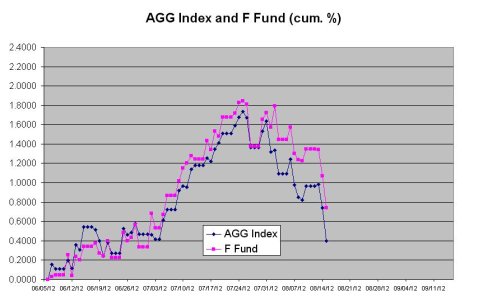
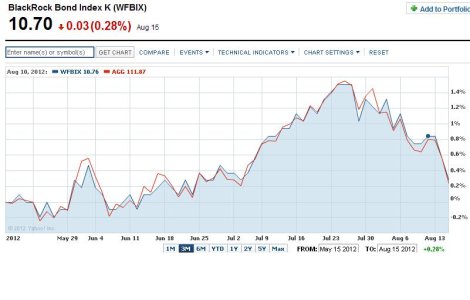
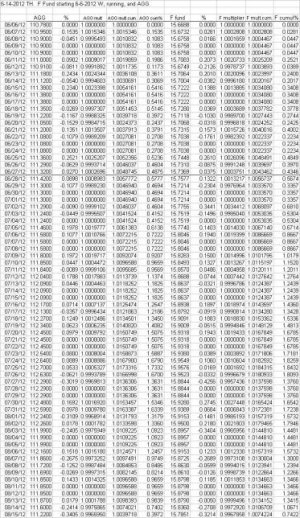
It was pointed out to me by the retirement seminar lady a couple of months ago that the appropriate Index to compare the F Fund to is not AGG (Barclays Accumulation) but BlackRock (WFBIX), so I finally decided to compare using Yahoo Finance and I show it here. They are close. I also show my own comparison chart of AGG and the F Fund and table of the same. AGG & F Fund Comparison Chart 20120605 to 20120815.JPG AGG & WFBIX Comparison Chart 3 months 20120815 Yahoo Finance.JPG

AGG & F Fund Comparison Table 20120815.jpg
 
Re: Ego trading

They are indeed close. As far as the F Fund matching the AGG, I believe if you were holding AGG you'd be getting dividends paid around the 1st of each month. I think that is why you're seeing separation between the F Fund and AGG.
 
Bullish indicator

"The stock market always went up at least 35% within 16 months. This would equate to the S&P hitting 1800 by November 30, 2013. Furthermore, the stock market went up at least 42% before the bull market/bear market rally ended. That equates to 1958 on the S&P.

In summary, this is yet another indicator that suggests that one should have a substantial stock allocation in their portfolio."


Indicator At Levels Only Seen Near The Epic 1932 And 2009 Stock Market Lows | Markets | Minyanville's Wall Street


Yet another dangling carrot. I'm having a hard time pulling the trigger while we are at these current levels. Am trying to wait this thing out a bit until we get a meaningful pullback...sure don't like missing out on gains though. The never ending dilema.
 
Re: Bullish indicator

Same over here. Tom should put a fourth choice on Biden: d) I don't care. Hell, they could replace him with Daffy Duck and it would be fine with me.
I think he needs to change his meds.
 
Late August wave update

Seems like Daneric has been talking about this impending wave 3 down for a very, very long time. It still may happen the way he describes, but it's easy to get overly cautious and miss out on substantial gains...like I have this year. Still something to keep your eyes on in the next couple of months. Nevertheless, buy low sell high...and we are currently at a high point. The next couple of days could be interesting, I'm still debating whether or not to pull the plug before Monday's holiday.

"There can only be one way to resolve a wedge: a price collapse from sheer exhaustion that declines in a manner that is at least equal with the total price rise of the wedge --- and thats for starters. So a rapid price decline to under 1000 SPX is to be expected in such a scenario."

Daneric's Elliott Waves


spxdaily.png
 
Re: Intermediate term

I was thinking something along the same lines. this last push was a big one, and I don't see us taking out previous lows on the 16th. unless that's taken out we can be seeing the start of a new uptrend. time to get bullish if the next low is a higher one than 11/16

After the fiscal cliff bogeyman is slayed we can see some explosive upward movement. damn im sounding like birch there haha
 
Long Term

Longer term view of the trends...


"A bit more subtle is the current PMO (Price Momentum Oscillator) pattern. Note how it resembles the PMO patterns around the two previous major tops. This pattern plus the approach of price to long-term resistance, leads us to believe that the bull market has very little time left."

Decision Point ®: Long-Term View - Chart Spotlight

6a0120a65d6eb8970b017c342430b2970b-pi
 
Back
Top