MrJohnRoss' Account Talk

It looks to me that the S&P touched that 38% Fib line around 1555 and decided that was enough... for now. The market got a bit oversold, and the three day rally looks like it will move us back above the 50 DMA. What's impressive is that it sliced right through it, no hesitation. What I'm looking for next is the convergence of the uptrend and downtrend lines near 1630-1635. Wouldn't be surprised to see some struggling between bulls and bears in this area. Decided not to chase this rally, as the upside appears limited in the short term, although this market has been able to frustrate many of us short term traders. I would have been more willing to put my money back into equities if the MACD and RSI had gotten deeper into the oversold area.


View attachment 24288

That's what I see. Bounce off the 38% line and now were testing resistance and the 50 dma. I am not surprised by the rally given the weekly Top 50 buy signal and bearish sentiment. I am a bit impressed by how much this market was able to retrace this week. Longer term, I'm can't be a buyer here. While a lot of short term stuff has turned up, my intermediate term indicators aren't there yet. Monday was a great day to take a shot at some short term gains as we were down hard that day and we knew sentiment was supportive at the time. If I'd had an IFT, I may have moved something back in just for the short term. No big bets, but the short term opportunity was definitely there.
 
Been away on vacation for almost two weeks, so haven't posted much lately...

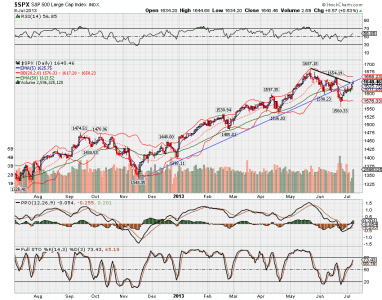
Here's a look at the S&P:


$spx.png

It appears that the market wants to continue this rally. Both the Stoch and PPO are heading higher, and the 50 day EMA is now sloping higher. Looks like the short term downtrend line may be broken, and the uptrend line may now provide support again. RSI is at 57 and trending higher, but not overbought. Also, the NY and NASDAQ Summation Indices have turned around and are now heading higher, which are additional positive signs. It appears that we *should* get at least a little bit of a move higher here.

Just keep in mind that it's earnings season, so anything may happen. Also, there is trouble in the bond markets, with rates trending higher (although not today). Throw in a dash of turmoil in Egypt, resulting in higher oil prices, the prospect of financial disaster in Italy, which could cascade across Europe, a slowing Chinese economy, and a whole host of other financial worries, and it seems that we're walking a tightrope here. Additionally, Martin Armstrong is calling for a short term market top on Aug 7, so we'll see if that comes to fruition as well.

Good luck!
 
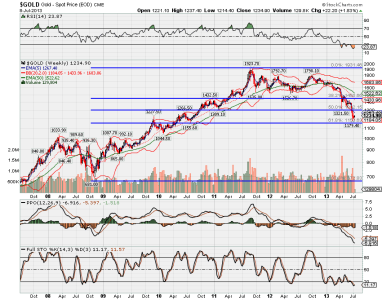
Six year chart of gold suggests a Fib retracement of 62% at $1,153. With gold currently at $1,235, that's still another 6-7% lower from here, so I think we may be getting close to a bottom.


$gold.png


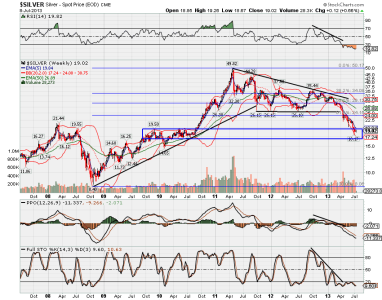
Silver has already blown through it's 63% retracement, but there seems to be a lot of support in the $17 - $19 area. Silver is currently at $19.02. I'd be surprised to see it go much lower than $17.


$silver.png

There is no evidence of an uptrend yet, so I'd be cautious about buying at this point. Stoch, PPO and RSI are all trending lower. RSI is WAY oversold. However, we may have weeks, if not months, of backing and filling before an honest to goodness bull market in PM's can begin again. When the bull resumes, I think there will be a LOT of money to be made.

Good luck!
 
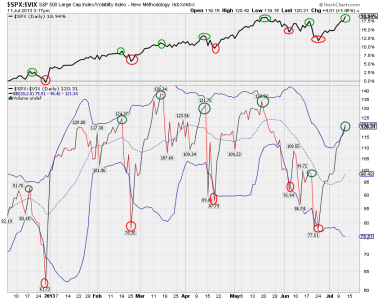
Temporary Top May Be Here: Analysis of the S&P vs the VIX:


$spx$vix.png

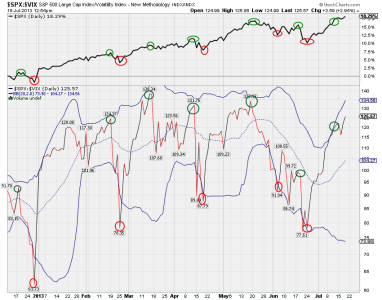
The upper window is the S&P 500. I drew green circles at what appear to be market highs, and red circles at market lows.
The lower window is the $SPX divided by $VIX.

Note that nearly every time we reached a short term market high (green circle), the $SPX/$VIX ratio was almost always at or near the upper Bollinger Band (mid June is the one exception).

Also note that nearly every time we reached a short term market low (red circle), the $SPX/$VIX ratio was almost always at or near the lower Bollinger Band.

And where are we now? ABOVE the upper BB!

Based on this simple analysis, I would say the odds makers would be likely to get paid for betting on a short term move to the downside in the S&P, and/or a short term move to the upside in the $VIX.

Good luck!
 
Temporary Top May Be Here: Analysis of the S&P vs the VIX:

Based on this simple analysis, I would say the odds makers would be likely to get paid for betting on a short term move to the downside in the S&P, and/or a short term move to the upside in the $VIX.

Excellent move on your part to go all in on July 8!! But does your above analysis mean that you will move to G tomorrow for your 2nd IFT this month? I am only half in so only got half of the July increase, but don't know if I want to use my 2nd and final IFT to exit so early in the month! :worried:

I am thinking that after the expected pull back you predict.....there will be another surge higher towards the end of July, and I don't want to miss that!

Drat that 2 IFT per month limit!!

I'm doubting that the pullback will be significant enough to warrant a move to the G Fund, espcially since that would put me out for the rest of the month. It does mean that I'm holding off in my other accounts to purchasing any more securities until we work off some excesses. If I was really brave, I would have purchased some SRTY (or TZA) and UVXY before the close, but it's been very easy to get burned betting against this bull market.
 
This market has been nothing short of incredible. The $SPX/$VIX ratio actually didn't go above the upper BB a few days ago, but it's still stretched to the upside. The recent ratio high of 138+ could be broken if this market advance continues. I wouldn't use this ratio as a timing system, but it does serve as a pretty good indicator of "overbought" vs "oversold".


$spx$vix.png
 
In other news... here's a nice pic of this morning's Atlas 5 launch from the Cape. ULA (United Launch Alliance) put a 7.5 ton communications satellite into orbit for the US Navy. The Atlas used five of our rocket motors to get this monster into space. A job well done!

Atlas 5 Launch.jpg
 
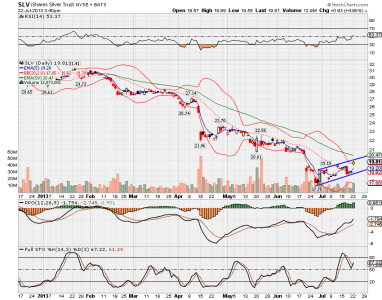
Gold and silver up strong today. Is the bottom now in place? Or is this a bear flag?

Personally, I don't think we'll go much lower, or at worst, a re-test of the lows.


SLV.png

Good luck!
 
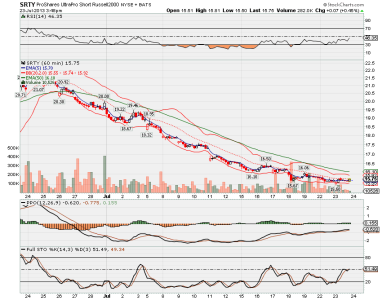
TZA or SRTY anyone? 1 hr chart of SRTY. This looks like a nice glide path and landing... before it heads back up.

RSI, PPO and STOCH all heading higher, showing divergence with price.


SRTY.png

Good luck!
 
I would like to try to remain fully invested for the rest of July. When you enter a new month, and you're in equities, you can use your two IFT's to get out and get back in again, and still have your "get out of jail free" card to get back out again. This always gives you the most options.

Conversely, if you are in the G Fund at the start of the month, your two IFT's can only be used to get in and back out. This has happened to me several times, and it causes havoc with timing issues trying to get back in at a good entry point.

Of course, all of this is a moot point if the market forces your hand to move to cash before the end of the month (i.e. a large market correction). I'm just saying that it's usually in your best interests to try to be in equities on the first of each month.

With one week left in the month, let's see how this plays out...

Good luck!
 
TZA or SRTY anyone? 1 hr chart of SRTY. This looks like a nice glide path and landing... before it heads back up.

RSI, PPO and STOCH all heading higher, showing divergence with price.

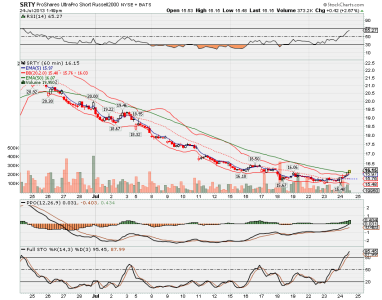
Well, if anyone took a chance, it looks like TZA or SRTY would have been a pretty good trade so far.

Let's see how the rest of the day plays out, but it's looking pretty strong right now.


SRTY.png
 
Back
Top