MrJohnRoss' Account Talk

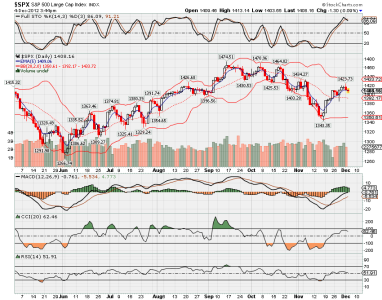
Using Fibonacci retracement levels, this market up-move reversal has reached the 50% level. It may be done here, or if it stops at the 61.8% level, it would put the S&P up-move ending around 1424 before heading back down.

This would also suggest a total down move (1.38, 1.5 or 1.618%) to one of these levels on the S&P: 1294, 1278, or 1262.

It will be interesting to see if this starts to play out this week.

Good luck!

So, was 1424 the top of the rally? If so, Fibonacci was spot on again. From the graph below, looks like the top hit 1423.74. Not too shabby.

It certainly appears that the Stocahstics oscillator is beginning to roll over and head back down. The faster %K line has crossed the slower %D line. Once it crosses the 80 line, you'll likely see an acceleration of selling.

Now is not the time to be buying into this market, in my opinion. I may have missed this rally, but I have a feeling it may go up in smoke before too long.

Sounds like the republicrats can't figure out how to come to an agreement, so the fiscal cliff looks more and more likely. All bets are off if we suddenly get news from Washington that a deal has been reached, but I'm certainly not counting on it. If that were the case, my guess is we would see an immediate rally lasting a day or two, until the smoke clears. From there, it could be time for a mini Santa Clause rally.

Good luck!

$spx.png


:)
 
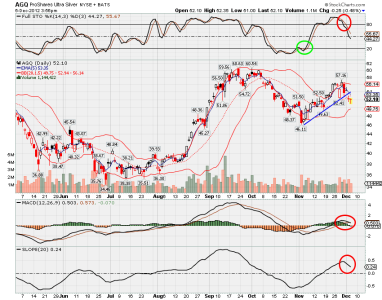
For those of you who like to follow gold and silver, here's a chart of my favorite play, AGQ, the 2X silver ETF.

As you can see, AGQ was in a solid uptrend since early November. It stayed within a nice channel until just the last few days, when it finally broke below.

Notice that the Stochastics indicator gave plenty of warning before breaking the trendline. First was the fast line crossover, followed by the lines crossing down below 80, which is typically a sell signal.

Other indicators showed slowing momentum, such as the MACD histogram peaking and heading lower, and the 20 day slope moving from an uptrend to a downtrend.

A good entry would have been at the Stochastics crossing up over the 20 line on Nov 6, where AGQ closed at 49.77.

A sell on the Stochastics crossing down below 80 would have gotten you out on Nov 30 @ 53.84, for a nice 8% gain.

Although my entry was a little late, and I got stopped out early, these are the kinds of signals I strive to implement in real time.

Good luck!


AGQ.png
 
i have not followed you for awhile for the simple fact i just didnt follow any one for awhile. i noticed according to your last entry you went 100% G and according to your charts you post and with the past behind us it was about the time the market was climbing. i do however agree now is not the time to get into the market with its overbought mode we are in and the next week according to seasonality(50yrs data) is usually negative. you can give me the argument of 'but seasonality has not held true in recent years' and i will agree with that except this year has been closer to it the the las 3 or more. just my opinion. however i do like your stats with the Fibonacci stuff because it seems to be "spot on" majority of the time.

thanks for your info because weather i agree or not it is always useful.
 
John, nice to see you jumping in today. That actually adds greatly to my bullish stance :D.

I also see that the Seven Sentinels ST and LT trends sync'd on the uptrend, that can't hurt either.
 
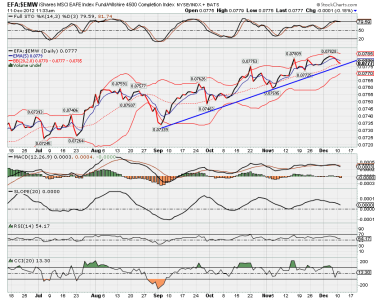
Went 100% I Fund this morning. This was based on the strong move in the markets, and the fact that the relative strength of I has been superior to either S or C since September. (Below is the graph of I vs S). As long as this trendline isn't broken, the I Fund is the place to be.

The risk here, of course, is that as we get closer to the fiscal cliff, the markets will tank. Apparently the markets are thinking we are closer to a deal than the media is leading us to believe? Or is this just a head-fake rally?

For those of you who are using today's market strength to sell and lock in your gains, I don't blame you. I've only made 9.5% this year, which would normally be considered a pretty good year. However, being a permabull like birch (15.1%) has certainly paid off, especially being heavily invested in the I Fund. He must be rubbing his lucky rabbits foot.

The pendulum will swing again, and I have no doubt that the nimble will perform better than the "buy and holder's" in the future. In the meantime, I'll be keeping my finger on the trigger in case the market looks like it's gonna go over the cliff.

EFA vs $EMW.png
 
I bought into the I fund awhile back as a proxy for exports into the emerging markets which have all broken out and rising - the I fund individual companies are going to do just fine as the emerging economies begin their expansions.
 
I bought into the I fund awhile back as a proxy for exports into the emerging markets which have all broken out and rising - the I fund individual companies are going to do just fine as the emerging economies begin their expansions.

Sounds like fundamental-speak to me. I still think it's the rabbit's foot...
 
Looks like AAPL may test the $500 mark soon, possibly today. I expect a lot of traders will jump in when it goes below that level, so it should be a strong support area.

Anyone thinking of taking a nibble? Could be ripe for a dead cat bounce.
 
Also surprised to see the I Fund in the green so far today, with most of the US major averages in the red. Looks like the Nasdaq, Dow and S&P are all beginning to roll over to the downside. Stochastics on all three have moved below the 80 line, which is bearish.
 
Actually yes :)

I think a short term trade could be profitable here. We might see a .62 Fibonacci retracement to the 560 area. Downside may be limited to 500. The odds appear pretty good. If we crash through 500, all bets are off. Below 500 would be a good stop location. Good luck!
 
A lot of people made good money in Apple this year and over the years. I love Apple as a valuation play but I can't help but think that people will be selling every rally to lock in those lower capital gains. I may be a big buyer on Dec 31. :)

Good luck!
 
Looks like AAPL may test the $500 mark soon, possibly today. I expect a lot of traders will jump in when it goes below that level, so it should be a strong support area.

Anyone thinking of taking a nibble? Could be ripe for a dead cat bounce.

apple is getting smashed, i'm not touching it yet haha. appears like it may be in breakdown mode and can go even further down than 500
 
Didn't the 50 day moving average do a death cross with the 200dma recently?

didn't check that, but I'm looking at the breakdown out of the bear flag and full stochs doing a bearish cross (wait till the EOD to confirm that). not a good sign for anyone long in apple imo

there may have some support at 505 but tbh, i wouldn't be surprised if that doesn't hold.
 
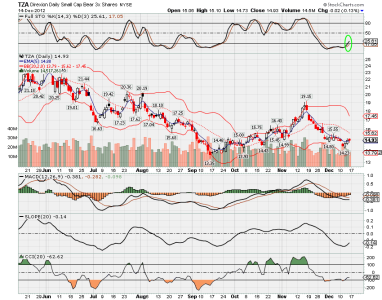
Hmmm, interesting. Jtrader abandoned TZA just as the stochastic turns up from oversold and crosses the 20 line. That's usually a pretty good buy signal. He's done very well this year, but not sure this was the right call. Thoughts @Jtrader?
 
Hmmm, interesting. Jtrader abandoned TZA just as the stochastic turns up from oversold and crosses the 20 line. That's usually a pretty good buy signal. He's done very well this year, but not sure this was the right call. Thoughts @Jtrader?

A buy signal as in a bullish buy? If so XIV is bullish for VIX in hopes that the VIX goes down I think...so isn't this a "buy signal" that you are speaking of? Thanks!
 
Hmmm, interesting. Jtrader abandoned TZA just as the stochastic turns up from oversold and crosses the 20 line. That's usually a pretty good buy signal. He's done very well this year, but not sure this was the right call. Thoughts @Jtrader?

maybe didn't want to hold over the weekend is my guess. a lot can happen over the weekend in especially a news-driven market
 
A buy signal as in a bullish buy? If so XIV is bullish for VIX in hopes that the VIX goes down I think...so isn't this a "buy signal" that you are speaking of? Thanks!

Yes, usually when the stochastic has been in an "oversold" condition, and moves up and across the 20 line, it typically produces a buy signal. (See green circle below). This just happened with TZA, so most traders would be buying here. I realize that jtrader has his own signals, but I just found it rather interesting that he's selling here.

tza.png
 
Back
Top