MrJohnRoss' Account Talk

I never have to make the decision to get back in - I'm never out.

You Permabull, you.

I consider it cheap insurance to step aside when we are in a down-draft. The S&P was at 1432.84 when I got out. Looks like it's around 1427 now, so I didn't miss any big carnage, but it sure could have gone down more.

Let's hope this isn't just a little head fake rally for a day or two before we head back down. I'm concerned that the 20 day and MACD both have a negative slope, and the MACD is has yet to cross up (although it's a slow indicator). I do like what I'm seeing in some of my other indicators, though.

So just be careful Birch, and lace up your sneakers. One of these days you may want to be a little more nimble.
 
Keeping my eye on the dollar (UUP) and the VIX. Both up sharply. This does not look healthy for the market.

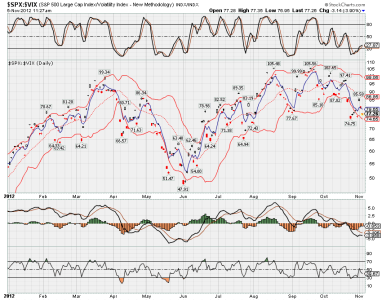
The graph of the $SPX divided by the $VIX (below) is looking weak. The 5 day EMA, the 20 day SMA, the Stochastics and the MACD are all sloping down now. Was hoping to see a bigger bounce off the oversold condition, but the bounce was pretty pathetic.

$spx$vix.png

The short term bounce in the market last week is beginning to look like it's losing steam. No sell signal yet, but I think it's wise to be cautious here. Don't be surprised to see me jump back to the lilly pad if things get rough.

Good luck!
 
Got handed a double dose of bad luck.

1) My buy signal occurred on Nov 1, not one day earlier (Oct 31), so I burned one IFT to get into the market. Dang!
2) Being 100% invested, the largest one day drop for the year flew in by black swan. By the time I saw the carnage, it was too late to sell. Double Dang! (not that I wanted to sell on such a large down day).

Hoping for a bit of a dead cat bounce today, as I will be selling my equity positions, and moving to the lilly pad.
This burns both of my IFT's, so I will be sitting on the sidelines for the rest of the month. Triple Dang!

Also...
Since Romney lost, anyone holding coal stocks got slaughtered yesterday. Example: See the chart for ANR or JRCC.
Since Obama won, anyone holding gun stocks got a nice gift yesterday. Example: See the chart for Ruger (RGR) or Smith & Wesson (SWHC).

Good luck everyone!
 
Sitting at 10.53% for the year on the AT, and do NOT want to see any more of that evaporate. Must employ a capital preservation mode at this point.
 
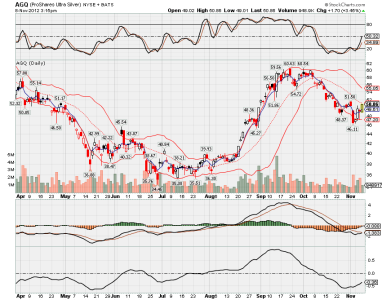
Speaking of charts, silver has been slammed since it's recent high of $35.44 on Oct 1, down to it's recent low of $30.66 on Nov 5. That's a drop of -13.5% in a little over a month - ouch!

My favorite way to play this is with the 3X Silver ETF, AGQ, which hit a high of $60.54 on Oct 1, then fell all the way down to $46.11 on Nov 2. That's a drop of... -23.8%. Wow!

I like the chart of this ETF enought that I just bought a nice chunk at $50.76. Even if it only goes back up to it's October high, that would be a 19% gain. Perhaps with all the uncertainty in the financial world right now, we may see PM's go even higher.

Good luck everyone!

AGQ.png
 
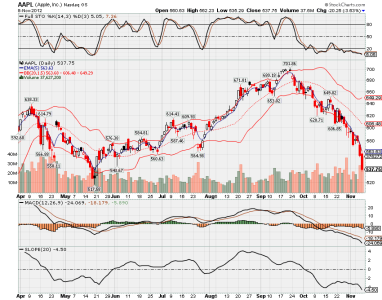
AAPL now at 537.75, down 23% from it's high of 701.86 on Sep 21.

Anyone buying? I would not want to catch this falling knife.

Just one more example of why "buy & hold" doesn't always work. Sheesh.

aapl.png
 
no sign of strength yet, i wouldn't touch it right now. trying to pick the bottom when the stock is in breakdown mode is a risky gamble.

curious to see if there would be a double bottom play around the 520 mark, but in this case i would wait for reversal signal + confirmation (some strength in the stochastic / MACD readings would also help)

Exactly.
 
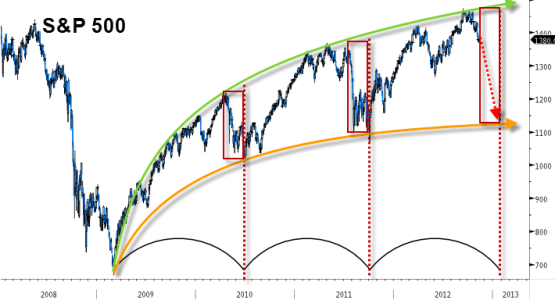
For those of you who enjoy the beauty of symmetry in nature, and in the markets, you may enjoy this graph of the S&P 500:

S&P symmetry.png

Good luck!
 
Hey JR, you trade PMs right? looking at gold's 9 month chart, looks like a cup & handle might form? could be a monster one if that materializes :)
 
Hey JR, you trade PMs right? looking at gold's 9 month chart, looks like a cup & handle might form? could be a monster one if that materializes :)

Absolutely. I love gold, and especially silver here. Both have very bullish charts right now.

If gold only goes back to it's high set on Oct 4 ($1798), it will gain 4%.

If silver only goes back to it's high set on Oct 1 ($35.44), it will gain 9%.

... and AGQ will gain ~ 15%. Not too shabby.

Eventually, when enough money printing is created to break the back of the economy, the only scenario will be massive inflation, which will mean PM's will be your only hope of remaining solvent. It's just a matter of time, in my opinion.
 
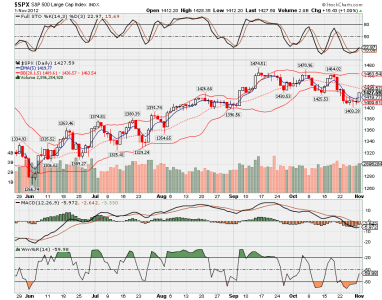
Looking back on my trade to get back in on Nov 1, here's the chart that was showing a positive upswing.

Note the upturn in the Stochastics Indicator, the MACD turning up, and Williams %R rising from an oversold condition.

This coincided with a strong up day, price coming up from under the Bollinger Band, and the 5 day EMA turning up.


$spx.png


Even though all these signs were positive, by the end of 5 trading days, the rug got pulled from underneath the markets, and I lost money.

Just goes to show that you have to watch the markets carefully, because they can turn on a dime. You have to be willing to cut your losses as soon as possible, and not wait for the market to come back up to where you bought it. Yeah, I lost ~3.5% on this trade, but if I had stubbornly held on, hoping for a rebound, I would be down about 5% today.

Good luck!
 
Back
Top