MrJohnRoss' Account Talk

I've seen many of you using timing systems to buy TNA and TZA. I have a few questions as I'm about a year old in my investment infancy. First, are you buying these as part of an IRA or is it just a personal account? Also, I'm curious, do you use the chart and technicals of TNA/TZA to determined your entry/exit or do you use a broad index like NASDAQ or S&P along with other indicators?
 
I've seen many of you using timing systems to buy TNA and TZA. I have a few questions as I'm about a year old in my investment infancy. First, are you buying these as part of an IRA or is it just a personal account? Also, I'm curious, do you use the chart and technicals of TNA/TZA to determined your entry/exit or do you use a broad index like NASDAQ or S&P along with other indicators?

Yes, both.

Use the S&P (or SPY, 1xS&P ETF) or IWM (1x R2K ETF)
 
I've seen many of you using timing systems to buy TNA and TZA. I have a few questions as I'm about a year old in my investment infancy. First, are you buying these as part of an IRA or is it just a personal account? Also, I'm curious, do you use the chart and technicals of TNA/TZA to determined your entry/exit or do you use a broad index like NASDAQ or S&P along with other indicators?

Everyone has their own methods. I occasionally use TNA/TZA in both my Roth IRA's and 401(k) at work, and try to manage risk by not betting the entire farm.

I primarily use technical analysis of TNA to help with timing decisions, but also look at the S&P and others as well.

I also use a spreadsheet to do some laborious mathematical calculations each day to help me decide when to buy/sell.

Hope that helps.
 
Just took a peek at the AutoTracker. Interesting to see the C Fund at +17.8%, and the S Fund at +16.8% for the year. It's rare, but buy and hold has obviously beaten most of us this year. I'm sitting at +14.4%, but things could get real interesting this coming month, and the final quarter. Birch would love to see this market blast higher, but I think there's good reason to be cautious, even though I'm currently 100% S.
 
This is from Yahoo Finance...

"Since 2009 the S&P has gained an average of 9% during the last 3 months of the year, and over the last 30 years, stocks have risen in Q4 24 out of 30 times for an average 7%..."

Q: Will we have a repeat this year???
 
This is from Yahoo Finance...

"Since 2009 the S&P has gained an average of 9% during the last 3 months of the year, and over the last 30 years, stocks have risen in Q4 24 out of 30 times for an average 7%..."

Q: Will we have a repeat this year???
I never believed much in seasonality type analysis. It always sounds good but every year is different for many reasons. For it to pay off you'd have to follow it all the time. Who knows how this year will turn out but the odds seem to favor an up move.
 
Just took a peek at the AutoTracker. Interesting to see the C Fund at +17.8%, and the S Fund at +16.8% for the year. It's rare, but buy and hold has obviously beaten most of us this year. I'm sitting at +14.4%, but things could get real interesting this coming month, and the final quarter. Birch would love to see this market blast higher, but I think there's good reason to be cautious, even though I'm currently 100% S.

not looking good right now barring some serious dip buying, but it looks like a breakdown and bears are jumping on it (looking at russell 2000 activity)
 
If the market drops 10% in the next week, do you know what to do?

The Ultimate Stock Strategy for the Coming Correction

I don't get it, is this link supposed to contain some value? It looks like a sales pitch, what's your cut? :)

Actually, It says Dan Ferris wrote the article, I think that's Birchtree's real name. All the article really says is to buy blue-chip and hold with the dividends. I'm gonna tattoo that mantra on somebody's forehead soon!:laugh:
 
I have a W tattoo on each butt cheek - you can guess the message. Stay fully invested and enjoy this liquidity driven bull as the hedge funds start buying to maintain their customer base. There's another 200 point day arriving soon to cramp some bears. Romney knows what needs to be done...
 
I have a W tattoo on each butt cheek - you can guess the message. Stay fully invested and enjoy this liquidity driven bull as the hedge funds start buying to maintain their customer base. There's another 200 point day arriving soon to cramp some bears. Romney knows what needs to be done...

You are a SERIOUS World of Warcraft player if you tattoo'd it on your butt... dang, you are hard core...
 
I have a W tattoo on each butt cheek - you can guess the message. Stay fully invested and enjoy this liquidity driven bull as the hedge funds start buying to maintain their customer base. There's another 200 point day arriving soon to cramp some bears. Romney knows what needs to be done...
Woodrow Wilson? Or is their a G on the left cheek?:D
 
I'm liking what's going on with AAPL lately. After a run that brought the price to over $700 recently, AAPL is finally taking a well deserved rest.

For those of you who are experts with Fibonacci analysis, please pardon my inexperience, but here's what I think may play out in the coming weeks.
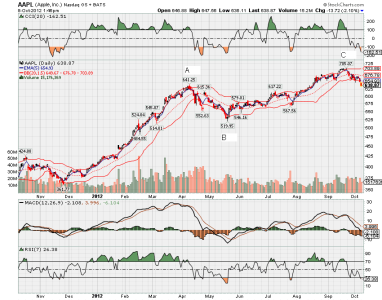

aapl.png


The chart above looks at AAPL over the past year. We had a nice run up from the $361 level up to $641 in early April (the point marked "A").

From there, AAPL took a well deserved rest, and fell all the way to the $519 level on May 18 (point "B"). That was a retracement of approx 0.81.

Two things to note here: Near high point "A", the MACD had a bearish crossover, and the 20 day EMA soon began heading lower.

At low point "B", the MACD soon crossed back up indicating a bullish formation, and the 20 day EMA (lagging indicator) gradually moved higher as well.

You can also see how the CCI, the RSI, and the Bollinger Bands behaved at these price extremes as well.

From that 5/18 low point until the high of $705 (point "C") on Sept 21, the stock gained a healthy 35%.

If the stock behaves going forward like it did this past year, here's what may play out...

A retracement of 0.81 from the high at point "C" would send the stock down to around $571.70.

I believe Fibonacci followers use a value of 0.786, which would put the stock a little lower... around $554.

I would look for the stock to bounce around a bit on it's way down, and perhaps find support near the $567 level, which appears to be a significant "line in the sand".

If we use the past time frame for future analysis, we could see this unfold by the end of October, around five and a half weeks from the peak on 9/21.

If the cycle repeats, buying in around the $567 level (watch for the MACD to bottom out and turn higher to confirm your long position), and riding the wave up another 35% would have you exit around $765. It might also be possible to catch a wave like we had from the $361 level in Nov 2011 to the $641 level set in Apr 2012. That wave provided a nice 77% gain, and would have you exit around $1,003. Markets love to pause at round numbers, and many analysts have said AAPL at $1,000 is only a matter of time.

In any event, I'll be watching what happens with the stock over the coming weeks, and if we get a good opportunity, I may hop on board.

Happy trading!

:)
 
Back
Top