MrJohnRoss' Account Talk

Folks, don't worry about the stock market falling. Have you heard of the Sports Illustrated Swimsuit Issue Indicator???

It says that the markets will perform better when an American model is on the cover than when a foreign babe is on the cover.

Statistics since 1978:

American on cover: Avg Return = 14.3%, Percent of Time Positive = 88.2%

Non-American on cover: Avg Return = 10.8%, Percent of Time Positive = 76.5%

Lucky for us, this year's model is American Kate Upton (who, by the way, looks stunning).

Party on, Garth!

:nuts:
 
[h=6]Happy Valentines Day!

Google this:

sqrt(cos(x))cos(300x)+sqrt(abs(x))-0.7)(4-x*x)^0.01, sqrt(6-x^2), -sqrt(6-x^2) from -4.5 to 4.5
[/h]
 
Can anyone help me? I'm trying to get an Excel graph inserted into a post. I've tried just about everything I can think of, without any luck. Anyone know how to do this easily???

Thanks in advance!
 
I tried and it told me I had too many characters. I think the file is just too large.

Yeah, same here. Tried copying from Excel, pasting into Word as a picture file (.PNG, etc.) then using the copy/paste function in the Advanced Mode to upload it. Fail.
 
The max .xls file size is current 500K.

If it's much larger than that, you can email it to me. I can put it on the server and you can just post a link.

If it is only slightly larger (maybe 550K) I can tweak the settings.
 
The max .xls file size is current 500K.

If it's much larger than that, you can email it to me. I can put it on the server and you can just post a link.

If it is only slightly larger (maybe 550K) I can tweak the settings.

Save chart as image and insert it that way.

Thanks RMI. As I said, I've tried saving the chart as a .PNG image in Word, then copying from Word and attempting to paste it into the Advance Mode, but it was a no-go. You cannot save a graph directly from Excel as a picture file.

Tom, I really don't want to send the entire .xls file spreadsheet, just the Excel graph. Any ideas?
I use "snagit" for stuff like that, but it's not free but they do have a 30-day free trial.

Download Snagit

It will let you cut and paste anything into an image.
 
Try this, open your page you want to copy from click Print Screen on your keyboard, open MS Paint, paste the screen capture, select and cut or copy the part of the Picture you want. Select make new file and paste it in the screen, save it as whatever jpg, png etc.
 
Thanks RMI. As I said, I've tried saving the chart as a .PNG image in Word, then copying from Word and attempting to paste it into the Advance Mode, but it was a no-go. You cannot save a graph directly from Excel as a picture file.

Tom, I really don't want to send the entire .xls file spreadsheet, just the Excel graph. Any ideas?

It isn't pretty:
select the chart and press CTRL-C
open MSO Picture Manager
press CTRL-V
Viola, now you have a PNG of your graph

Attach to your post!
 
It isn't pretty:
select the chart and press CTRL-C
open MSO Picture Manager
press CTRL-V
Viola, now you have a PNG of your graph

Attach to your post!

Try this, open your page you want to copy from click Print Screen on your keyboard, open MS Paint, paste the screen capture, select and cut or copy the part of the Picture you want. Select make new file and paste it in the screen, save it as whatever jpg, png etc.

Thanks guys! You're awesome!! :laugh:
 
I'm going to be trying out an improved version of my Timing System, using a completely seperate indicator than what I've used in the past.

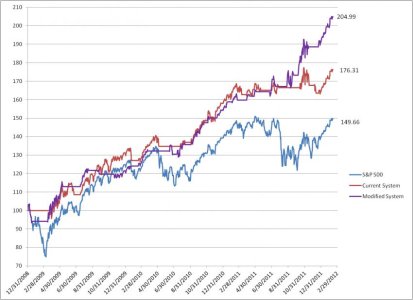
Here are the results of this improved system: Assuming an initial investment of $100,000 on 1/1/2009 (to make the math simple):

1) Buy & hold the S&P 500: Your account would have grown 49.6%, and would be worth $149,600. Good.

2) My Timing System: Your account would have grown 76.3%, and would be worth $176,310. That's an extra $26,710 in your account. Excellent!

3) Improved Timing System: Your account would have grown 105.0%, and would be worth $204,990. That's an extra $55,390 over buy & hold. Outstanding!

Take a look at the graph below to see all three systems in action.

Note that my original timing system and my improved timing system had the same virtual results as of 9/9/2011. From that point forward, my improved system clearly outperformed.

I will be using this new timing indicator in all future TSP trading decisions, which will be posted on this thread when a change is warranted.

Best of luck to everyone,

John

Improved System.jpg

Note that a well designed timing system easily outperforms buy & hold over the long term.
 
Last edited:
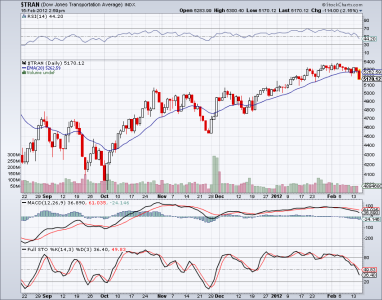
Uh oh. Don't look now, but the $TRAN is in meltdown mode. Houston, we have a problem.
Looks healthy so far. Connecting the Oct - Dec highs, it looks like there is strong support just under 5100 - where the inverted H&S broke out (test of the neckline).
 
Back
Top