MrJohnRoss' Account Talk

Agreed. It's based on volatility being proportional to the square root of time. So if you take the Vix of 9.93 and divide it by the square root of 12 (since there are twelve months in a year), you get 9.93 divided by 3.46 which equals 2.8% for one month. And based on statiscal analyses, this theory is correct 68% of the time. So as the Vix rises, you get a chance at a better return, but you also get wilder swings. Options traders love a high Vix number because the potential returns are so much higher. I am assuming that you are not familiar with this theory. If you are, I apologize. I don't want to insult anyone's intelligence or come across as an expert - BECAUSE I AM FAR FROM IT.

I follow your reasoning, but where did you come up with the value of 9.93 for the VIX, when we are currently at 20.48? In other words, doesn't VIX want to resort to the mean? And the farther away from the mean, wouldn't volatility for the VIX increase even more? Kind of like the stretched rubber band theory... If it gets stretched too far from "normal", it will snap back in the other direction. With the VIX this low, I would think that the mean would be tugging pretty hard on it to get back to "normal".

Am I way off base?
I looked at your post too quickly (was in a hurry). The top says the Vix is 9.93. I should have looked at the chart more closely. Accordingly, the % would be 5.9%. So as of today, there is a 68% chance that the market will change by 5.8% within the next month, if the Vix remains in the low 20's. If the Vix changes significantly in the next few days the number will change. Thanks for catching my error. The 5.9% can be positive or negative. Some people will only buy when the Vix is 20 or below, because staistically, the can only lose 5.9%. The higher the Vix, the higher the percentage gain or loss.
 
Last edited:
Sold my remaining TNA this morning @ $59.99. Purchased on Jan 10 @ $49.36. That equates to a 21.5% gain in a little over a month.

Unless I missed it, I don't recall you saying you were buying TNA on the 10th, at least not here at TSPtalk? Does that mean you were in TZA before that?
 
Unless I missed it, I don't recall you saying you were buying TNA on the 10th, at least not here at TSPtalk? Does that mean you were in TZA before that?

I generally only mention my TSP trades here, but several other people were just recently discussing their trades in other accounts with TNA, so I mentioned mine as well.
 
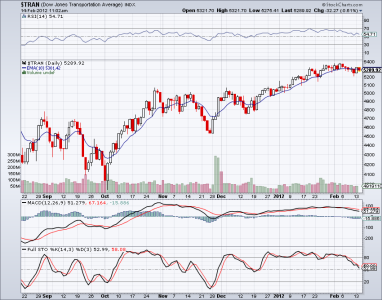
Take a look at the Dow Transportation Index. It was once the leader, pulling up the rest of the indices.

Now it is rolling over rather clearly, and has broken below the 20 day EMA. This is not a good sign for continuing up in the Dow, S&P and NASDAQ.

Also notice that the MACD and the Stochastics indicators have both turned lower as well. Pretty ominous signs, IMHO.

tran.png
 
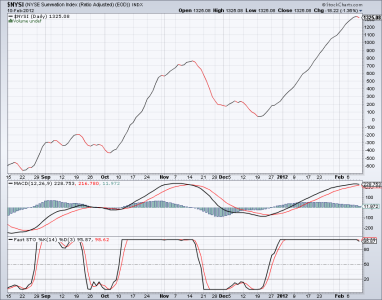
Also take a look at the NYSE Summation Index. Note that we've had our first down day since Dec 19. The NASDAQ Summation Index looks very similar, and also had it's first down day since Dec 28.

If we see further selling on Monday, there could be enough shots fired into our ship to send us into sell mode. Monday will be a very pivotal day, to say the least.

nysi.png
 
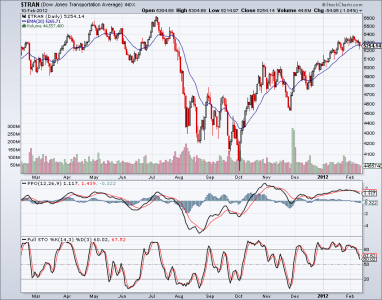
Looks to me like the market is beginning the process of rolling over. The Dow Transportation Index was our leader to the upside, now it appears to be leading us to the downside. Notice the rounded top formation.
You can also see that the MACD and especially the Stochastics are heading down, and pulling the index lower. Could it be that a correction is (finally) beginning to take shape?

$tran.png
 
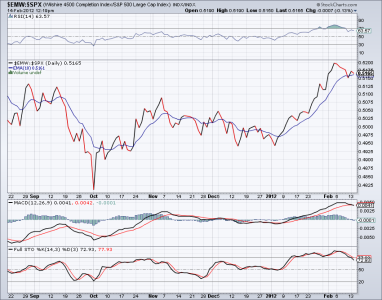
Graph of S Fund vs C Fund:

Based on the graph below, it appears that the C Fund is beginning to outperform the S Fund. (Remember, when S is stronger, the line moves higher).

Note that we peaked on Feb 3, and the C Fund has been outperforming since that time.

This makes sense, since S will outperform C in strong market conditions, and C will not fall as much as S when the markets are weak.

(This is another way of saying that S has a higher beta value than C.)

Of course, if we get a sell signal, none of this will matter, as I'll move to the G fund and wait for the rebound.

Be careful out there. Although we don't have a sell signal yet, unless there's some dramatic improvements, it's just a matter of time until we do.

S vs C.png
 
Last edited:
I've noticed that when the "S" fund is hot it's hot in both directions, UP and Down.

Good eye, double N double U Tee. That's known as a "high beta". Think of beta as a multiplier. The S&P 500 has a multiplier of 1.0. If a stock, mutual fund, ETF, or index has a higher beta (for instance 1.2), then you would expect it to go up 20% more than the S&P when the market goes higher, and fall 20% more when the market goes lower. That's why I like to use the S Fund when my timing system moves to a buy signal, and go to the G Fund when it goes to a sell signal. That helps me take advantage of the upside as much as possible.
 
Just for clarification, lagging indicators can't pull the index down, the tail does not wag the dog. :)

JTH, technically you are correct. My point was that if you observe the MACD and especially the Stochastics indicators, their slopes are heading downward much faster than the underlying security, hence the pulldown observation.

I like to visualize the Stochastics as the position of the "gas pedal", the MACD as the "tachometer", and the underlying security as the "relative speed of the vehicle". But that's just because I'm a car racing nut. Go figure. :toung:
 
Too bad, so sad...

Headline: An Iranian man has blown off his own legs and wounded at least four other people in grenade attacks in Bangkok, according to the police...

...enjoy your misery, scumbag.
 
I like to visualize the Stochastics as the position of the "gas pedal", the MACD as the "tachometer", and the underlying security as the "relative speed of the vehicle". But that's just because I'm a car racing nut. Go figure. :toung:

Good example, what's the Tranny?
 
Apple (AAPL) is now testing a key resistance line that has had negative implications for the stock (and the S&P 500) since 1995.

http://blog.kimblechartingsolutions.com/wp-content/uploads/2012/02/applelongtermresistancefeb131.gif

If I held AAPL, (which I currently don't), I'd be dumping it like a hot potatoe at these prices ($505/share).

Yeah yeah yeah, I know, blowout earnings, new products, etc., etc. Doesn't matter. It's gone too far, too fast. Get ready for a correction.

With AAPL now being the largest corporation on earth, when it falls, it will take the S&P and NASDAQ with it.
 
Back
Top