MrJohnRoss' Account Talk

No point in getting out now...even if it goes lower. :nuts:

Definitely investors are getting a taste of what it is like when volatility returns to spank the market but good. As alot of the old timers can testify it can get a whole lot worse than just a measly 1-2 percent down day. Try 3-4 percent down days. That will really make you sick to your stomach.

Another thing...when we use charts or consistency or past performance, trends, or any other type of market analysis, these do not take into account exterior events like being nuked, oil collapsing fast, FED making a sudden interest rate increases, terrorism and the like...so these well thought out plans to move in and out don't work out like we hope. If your in...hopefully tomorrow will be a better day. If your out...wait it out until the market regains footing. I took the plunge today hoping for a rebound later in the day on Tuesday. Right now, not sure if that was a good move...but we will see. :worried:
 
If your in...hopefully tomorrow will be a better day. If your out...wait it out until the market regains footing. I took the plunge today hoping for a rebound later in the day on Tuesday. Right now, not sure if that was a good move...but we will see. :worried:

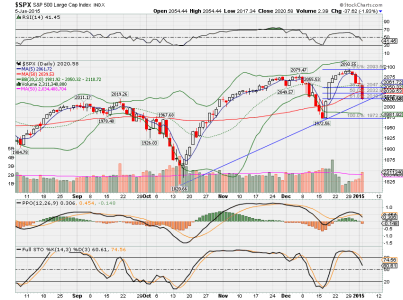
Well, since we're roughly 20 S&P points below the 50 day, it certainly reduces your risk to jump in at this point. Looks like the market is forming a short term bottom on the 10 min chart.
 
The S&P has now hit the 62% Fibonacci retracement level from the Dec low to the Dec high. This would be a logical place for the market to begin to regain it's footing, as ftc would say. We're also very near the uptrending line connecting the Oct and Dec lows.

Tomorrow may be a do-or-die day. I'll post tomorrow's historical stats later when I get some time, but I do believe it's historically a + bullish day.
 
Here's a chart looking back at last year's IFT's. It's a simplified version of being "in or out" of the market. Some of the moves were to the C Fund, but most were to the S Fund, so this is still illustrative in one graph.

Obviously not all of my moves were successful, and many were ill timed. The important thing at this point is to look back on history, learn from it, and try not to repeat past mistakes. I did manage to make a respectable showing on the AT (17.69%), and beat the C Fund - S&P500 (13.78%), which is all I could have asked for.


View attachment 31811

Good luck to us in 2015!
Hello Mr. John Ross, Congratulations on your results this year. I really like your chart. Great visual. Is there a particular stock charts plan that you subscribe to that enables this type of chart making. I am thinking about subscribing this year and not sure what to select. Any advice you can offer is appreciated. Thanks and best wishes for 2015!!
 
Hello Mr. John Ross, Congratulations on your results this year. I really like your chart. Great visual. Is there a particular stock charts plan that you subscribe to that enables this type of chart making. I am thinking about subscribing this year and not sure what to select. Any advice you can offer is appreciated. Thanks and best wishes for 2015!!

Thanks DBA, I use the "Extra" subscription. It's a nice upgrade from the basic, but not as fancy (or as expensive) as the Pro.

Watch for sales. Several times a year they have specials, i.e., 15 month subscriptions for the price of 12.

Good luck to you as well!
 
Thanks DBA, I use the "Extra" subscription. It's a nice upgrade from the basic, but not as fancy (or as expensive) as the Pro.

Watch for sales. Several times a year they have specials, i.e., 15 month subscriptions for the price of 12.

Good luck to you as well!
Thank You!! :)
 
The S&P has now hit the 62% Fibonacci retracement level from the Dec low to the Dec high. This would be a logical place for the market to begin to regain it's footing, as ftc would say. We're also very near the uptrending line connecting the Oct and Dec lows.

Tomorrow may be a do-or-die day. I'll post tomorrow's historical stats later when I get some time, but I do believe it's historically a + bullish day.

Here's a chart of the S&P based on the above comments. This market needs to hold in this area or it could spell trouble.


$spx.png
 
Historically, here are the odds of for Tuesday, Jan 6th having a positive close:

DJIA: 52%
S&P500: 62%
Nasdaq: 57%
R1K: 63%
R2K: 63%

Tomorrow is considered an especially "Bullish" day, FWIW.
 
MJR,

Good chart information. Question: How do you place the Fibonacci %centage levels with Stockcharts? Tia.

Just click on the top (or bottom) of the price level you want to measure, and drag and stretch the tool to the top (or bottom) of the range you want to measure. It automatically places the Fibonacci percentages in for you. Very simple.
 
Just click on the top (or bottom) of the price level you want to measure, and drag and stretch the tool to the top (or bottom) of the range you want to measure. It automatically places the Fibonacci percentages in for you. Very simple.

MrJohnRoss,

Thanks again for your help with using the tools in Stockcharts. It does take practice to be proficient with many of these tools. In another concern, I would like your opinion regarding the continued drop in oil prices. There is no doubt that as consumers we are deriving immense benefits from this. However, according to the conversations in CNBC and Bloomberg this early morning, we now have oil under 49$, and Brent oil at a bit over 51$ In the U.S. we still benefit from an edge in technologies, and we are still producing shale oil without a very negative impact from the Saudi attempt to put oil producers out of business (the weaker outfits may be starting to feel the financial pain, but increased fears from some other countries has them producing oil at lower prices in an attempt to get some currency for their treasure chests), but the price of oil keeps dropping. Apparently, there is no end in sight to lower oil prices; perhaps the price might go lower than 40$. I suppose this is sort of unexpected and unchartered territory if the drop in valuations and prices should be abrupt.

How do you, or anyone who may want to shed some light on this subject, reconcile this drop in oil prices with the idea that the valuation in stocks, even in small caps which have a lesser exposure to oil holdings will drop lower. I am concerned with our expectations. I am concerned that we expect a bounce soon, but are we being too optimistic with the idea of finding a good bottom to bounce from? Tia.

Airlift, I wish there was an easy answer to your question, but it's not easy to predict the future to events like we have today. I'm sure you've read the many news reports and opinions of what falling oil prices mean to the markets, just as I have. Falling oil prices could produce a domino effect, which reduces cash flow to producers, which reduces business to oil service companies, which reduces business to their suppliers, which cause layoffs, and on and on. Meanwhile, the Saudi's keep buying their gold plated, diamond encrusted Mercedes, yachts, etc., so it's no big deal for them.

There are also many other global concerns, and not all of them are tied to the price of oil. Slowdowns in the economies of China and Europe, Greece default, etc. are high on the list.

My only suggestion is to watch the market carefully, because it will tell you which direction it's wanting to go. We're in an aging bull market, but there are some cracks starting to appear on the walls, so be careful.

One thing's for certain, these sure are interesting times we live in, isn't it.
 
Don't look now, but NUGT and GDXJ have moved decisively above their 50 DMA for the first time since mid August. Is this for reelz? :nuts: :blink:

Metals and miners have been showing some pretty good strength lately. I've been afraid to post anything about it, because every time I do, the floor drops out. There certainly is low downside risk compared to upside potential, IMHO.

I bought a while back at $10 and sold around $11 for some quick profit and due to the volatility. I wish I would have hung on to it. I think if stocks go up Nugt will drop IMHO. Are you buying?
 
Back
Top