-
The Forum works well on MOBILE devices without an app: Just go to: https://forum.tsptalk.com
-
Please read our AutoTracker policy on the IFT deadline and remaining active. Thanks!
-
$ - Premium Service Content (Info) | AutoTracker Monthly Winners | Is Gmail et al, Blocking Our emails?
Find us on: Facebook & X | Posting Copyrighted Material
-
Join the TSP Talk AutoTracker: How to Get Started | Login | Main AutoTracker Page
You are using an out of date browser. It may not display this or other websites correctly.
You should upgrade or use an alternative browser.
You should upgrade or use an alternative browser.
JTH's Account Talk
- Thread starter JTH
- Start date


JTH
TSP Legend
- Reaction score
- 1,359
A side note, it took a few months, but my dad was finally able to move his Retirement Mutual Funds out, and it's now under his direct control in a IRA. Those mutual funds had very high expense ratios, and were spread across several risk categories. Since he's retired, it was time to take off the risk.
My dad thinks the economy is going to tank, and he correlates this to the stock market. I made that mistake cutting my teeth back in 2008, when I put too much faith in economist. So we take a bunch of data, that is flawed, missing, corrupted, and let Economist tell us what the outcome will be. I try to tell him "Economists have predicted nine of the last five recessions", but you know as well as I do, some folks are set in their ways.
Anyhow, what's important, is his money is secured, my hope is that he spends as much of it as he can before he kicks the bucket.
JTH
TSP Legend
- Reaction score
- 1,359
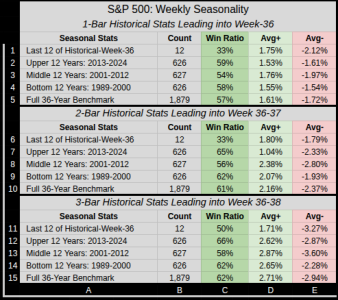
Seasonality wise we are entering the weakest part of the year.
- Kids back to school, dropped a bunch of cash in the process, then start looking to trim profits.
- End of Fed's Fiscal year (old unspent money pulled back early, new money drops late)
- Quarterly Re-balancing
- Last 176 Weeks of September (1984-2024)
- 48.3% win ratio Vs. normal 57%
- -.23% average September return Vs. .23% non-September return
- A total September Sum of -40.45%
Attachments
JTH
TSP Legend
- Reaction score
- 1,359
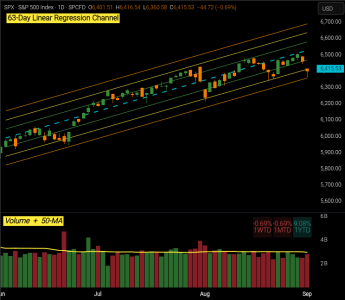
A nice near-kiss of the lower standard deviation 3 support channel.
- This -2.27% pullback is shorter in duration and deeper than the previous -2.21% pullback.
- Tuesday's Volume was 2.77B, last year it was 2.80B
- Average Volume for the first trading day of Sep 2017-2024 was 2.04B
- Average Volume for the first trading day of Sep 2009-2016 was 4.19B
- This means the last 8 years of volume is half the prior 8 years.
- The 63-LR Channel forward of the 7-Apr Yearly low was about 9.75% wide, now it's 5%
- Within the channel, peak-to-peak, we are losing momentum.
- 3-Jul 3.72%
- 31-Jul 2.27%
- 15-Aug .85%
- 28-Aug .41%
- Within the channel, peak-to-peak, we are losing momentum.
Attachments
Last edited:
JTH
TSP Legend
- Reaction score
- 1,359
Interesting turn of events for AVGO


- 12.61% WTD, 45.45% YTD
- Broadcom secured a $10 billion order for custom AI chips, widely believed to be from OpenAI
- Friday's opening gap was 16.23% which was nearly the high of the day, leaving us a 7.33% unfilled gap.
- While NVDA and MS closed the week down, AVGO and Google offset the difference.
- Total WTD drag from Top 2 (NVDA + MSFT) -.43%
- Total WTD pull from AVGO+GOOGL+GOOG was .84%
- 32 of the the Top-50 are > 50-MA, weighted at 39.46% of the index.
- 18 of the the Top-50 are < 50-MA, weighted at 22.55% of the index.
- Translated, this means 64% of 62% of the index is above it's 50-MA
- And the money still flows: S&P 500 ETF VOO experienced a 5-day net inflow of $3.21 billion.
- Breadth (by = weighted count) the number of stocks above their 50-MA has been declining while the index has been rising.
- If I had the juice, it'd be great to create a weighted Top-50 breath indicator, but since I don't have past data it's too much trouble to manually track it everyday.
JTH
TSP Legend
- Reaction score
- 1,359
This week's AI-JTH report.


 Equity Fund Outflows
- U.S. equity funds saw net outflows of about $43.19 billion for the week ended September 17, 2025—the largest weekly withdrawal since December 2024. reuters.com
- The prior week (ending September 10), outflows were $13.05 billion. ici.org
- Much of the selling has been masked by ongoing buybacks and systematic strategies, keeping index prices resilient for now.
 Current Margin Debt Levels
- Margin debt hit a new record high in August 2025 at about $1.06 trillion. api.advisorperspectives.com
- In July 2025, it was around $1.023 trillion, up from ~$810.8 billion a year ago. YCharts
- That’s a roughly 32.9% increase year-over-year. api.advisorperspectives.com
 What This Suggests
- Margin debt is near or above prior peaks (nominally). Adjusted for inflation, it’s also at historic highs. api.advisorperspectives.com
- High margin levels mean more leverage in the system, which amplifies both upside and downside.
- When combined with persistent outflows and concentrated market leadership, the risk of forced selling and sharp corrections rises if sentiment sours or leading stocks falter. barrons.com
Last edited:

JTH
TSP Legend
- Reaction score
- 1,359
Was that the pullback....?
 Probabilistic Weekly Forecast
Conclusion
 Equity Fund Inflows

Markets Recap – WTD Focus

S&P 500 Recap – WTD Focus

 S&P 500 Top-10 Recap – WTD Focus
Takeaway: The Top-10’s dominance (38.8% of SPX weight) softened this week as mega-cap tech leaders pulled back. But with AAPL and TSLA perking up, leadership may simply be rotating rather than disappearing.

Sector Rotation – WTD View
Cycle Context
Forward Look


Have a great week...Jason
Probabilistic Weekly Forecast| Scenario | Probability | Evidence (Weekly-Based) |
|---|---|---|
 Mild Drift Higher Mild Drift Higher | 45% | • S&P closed higher 3 of 5 days • Volume spike only once (Thu) • 63-LR positioning consistently strong • Past 11 sessions = +3.27% confirms gentle upward drift • Broad index held firm despite mixed Top-10 |
 Sideways (±0.5%) Sideways (±0.5%) | 40% | • Rank% all week = 31–54% → no conviction • ATR declining → vol compression• Sector rotation shows caution, not aggression • Volume low Mon–Wed and Fri |
 Pullback (> –1%) Pullback (> –1%) | 15% | • Slope still mildly negative • AMZN, META, GOOGL under pressure • No breakout volume• Defensive leadership (XLE, XLU) → market is hedging, not chasing |
ConclusionThe S&P is climbing a soft wall of defensiveness — not fear, but not euphoria either. Last week’s data tells us: buyers are present, but reluctant to chase. The most likely path is either continued slow grind or sideways chop, depending on whether volume and leadership broaden.
Equity Fund Inflows- + $12.06B net inflows into U.S. equity funds for the week ended Sept 24, 2025.
- First positive week after multi-week outflows.
- Prior week (ended Sept 17) saw – $43.19B outflows — the largest since Dec 2024.
- Reversal tied to AI optimism and Fed cut expectations.
 Other Notable Moves Last Week
- Markets: Stocks ended the week slightly lower overall, but Friday’s bounce on inline inflation data helped steady nerves. reuters.com
- Inflation: PCE report showed 2.7% YoY growth in August—exactly as forecast, keeping Fed watchers cautious.
- Tariffs: Trump announced new tariffs—100% on branded pharmaceuticals, 25% on heavy trucks, 50% on kitchen cabinets. Markets shrugged, but supply chains may feel it later. theguardian.com
- Corporate moves:
• Electronic Arts spiked ~15% on privatization rumors (~$50B).
• Boeing lifted by FAA easing delivery restrictions.
• Paccar surged after tariff news favored domestic truck makers.
• Intel extended its rally on partnership buzz. - Crypto: Bitcoin slid ~5% on the week, dropping below $110K.
Markets Recap – WTD Focus- Indexes: Despite Friday’s bounce, SPX and NDX still ended lower on the week. That contrast — inflows turning positive but indexes slipping — shows buyers aren’t yet pressing hard.
- ETFs: Mid-caps outperformed, small-caps lagged again. Breadth hasn’t expanded — leadership is still narrow and concentrated in a few names.
- Bonds: Yields stayed firm, leaving Treasuries slightly negative. The bond market is signaling doubt that rate cuts will come quickly.
- Volatility: VIX edged higher WTD even as stocks stabilized. Traders are hedging on the way down rather than chasing upside.
S&P 500 Recap – WTD Focus- Top-10: Slightly negative on the week, showing mega-caps cooled off. These leaders still control the tape, but without their push, index gains stall quickly.
- Mid-90: Also marginally lower WTD, echoing the large-cap drift. This confirms the bulk of “core” names aren’t breaking higher.
- Bottom-403: Quietly positive on the week — a rare sign of rotation into smaller constituents. It wasn’t strong, but it shows buyers poked around outside the top tier.
- All three groups remain well above Long-term moving averages, so the structure is intact.
- Short-term momentum (10–20 day) is flattening, suggesting digestion after the September run.
- The Bottom-403 holding up better than the Top-10 hints at early breadth improvement, but not yet enough to flip the trend.
S&P 500 Top-10 Recap – WTD Focus- Winners:
• AAPL (+4.1% WTD) stood out after lagging peers YTD, offering a stabilizing counterweight while other mega-caps cooled.
• TSLA (+3.4% WTD) surprised with a sharp rebound, carrying high beta momentum back into the group.
• BRK.B (+1.5% WTD) added quiet stability, reinforcing its role as ballast in the Top-10. - Laggards:
• AMZN (–5.1%) and META (–4.5%) were heavy drags, both slipping below short-term averages.
• AVGO (–3.0%), GOOGL (–3.2%), and GOOG (–3.2%) all eased back after massive YTD runs.
• MSFT (–1.3%) showed mild profit-taking, while NVDA (+0.9%) was steady but not leading. - Rotation signals: Strength in AAPL and TSLA against weakness in AMZN/META/GOOG suggests a shifting leadership mix. The “AI core” names cooled, while laggards staged tactical rebounds.
Takeaway: The Top-10’s dominance (38.8% of SPX weight) softened this week as mega-cap tech leaders pulled back. But with AAPL and TSLA perking up, leadership may simply be rotating rather than disappearing.
Sector Rotation – WTD View- Energy (XLE +3.9%) & Utilities (XLU +2.2%) led the tape — classic late-cycle leadership. Investors rotated into defensives (Utilities) and hard assets (Energy) even as broader equities stalled.
- Tech (XLK flat) and Comm Services (XLC –1.0%) cooled after driving YTD gains. AI beneficiaries and growth engines saw digestion.
- Consumer Discretionary (XLY –0.7%) and Industrials (XLI –0.4%) drifted lower, showing cyclicals weren’t bid aggressively despite some transport strength.
- Health Care (XLV –1.3%) and Staples (XLP –1.8%) lagged, unusual because they’re defensive sectors — this suggests rotation wasn’t a wholesale “risk-off” but more selective.
- Financials (XLF –0.7%) slipped, showing no broad relief from higher yields. Banks and insurers didn’t catch a bid even with rates firming.
- Materials (XLB –2.2%) sold off, pointing to weaker global demand expectations and possible China drag.
- Real Estate (XLRE flat): stabilized, but higher rates still cap upside.
Cycle Context- Late-cycle tone: Energy + Utilities outperformance is textbook late-cycle behavior, where capital shifts into cashflow-heavy, dividend-yielding sectors.
- Breadth isn’t there yet: Growth leaders cooled, but cyclicals didn’t fill the gap. This keeps the market in digestion mode rather than clean rotation.
- Macro tell: Bonds still firm → market isn’t pricing rapid Fed easing. Rotation into Energy/Utilities fits a “higher-for-longer” yield environment.
Forward Look- If Energy strength holds, it can cushion indexes, but it rarely leads into sustained bull legs.
- For a durable uptrend, you’d want cyclicals + midcaps to join. That hasn’t happened yet.
- If defensives keep leading while growth consolidates, it signals we’re closer to a late-cycle peak than an early-cycle reset.
Have a great week...Jason
JTH
TSP Legend
- Reaction score
- 1,359
A minor note, my active day trading account, is up 38% YTD
But that's not much to brag about, it's been leveraged trades, and mostly quick 3-4 day positions. It's really been a low effort haul, like throwing a stick of dynamite in a pond and scooping up the dead fish. The biggest issue, this type of market makes it difficult to test new strategies. Can any of us be good traders if we are all winning at the same time?
I would propose we are not all winning, in fact something else is getting lost here, true price discovery. None of this is worth what we think it is, yet we continue to buy these overvalued assets.
- Reaction score
- 3,014
Just to play devil's advocate, I remember someone telling me to buy Nvidia in 2017 (I was at a craps table  ) and I went home, looked at the chart and thought it was too expensive and had gone too far, too fast.
I did the same years ago with Amazon during the dot com days. I was actually selling it short. I thought, why is a bookstore so expensive? Thousands of percentage gains later...
It feels frothy but it's tougher to call a top than a bottom.
) and I went home, looked at the chart and thought it was too expensive and had gone too far, too fast. I did the same years ago with Amazon during the dot com days. I was actually selling it short. I thought, why is a bookstore so expensive? Thousands of percentage gains later...
It feels frothy but it's tougher to call a top than a bottom.
JTH
TSP Legend
- Reaction score
- 1,359
These Blog templates I've been working can sometimes be a huge ass pain. Perfection = I upload instructions and get both the correct output & format. This can take what might be 1-2 hours of human work and compress it into 5 minutes. While the AI does 100% of the output, I have to feed it scraps of data, and often make numerous "guiding" corrections.
On a good day it's about 10% human intervention, on a bad day (as with today) there just won't be a blog. The Pre-Coffee Brief is the smallest instruction set with 180 detailed steps, about 13 pages and 3K worth of words. Most often when AI has a melt-down (when overwhelmed they take shortcuts) it happens just before the market open. At present I am in the middle of a revise, and cannot not accurately blog a report.
Anyhow, 2025 looks good, I do wonder how many years we've both hit the statistical average 63-year low and high all in the same year?
JTH
TSP Legend
- Reaction score
- 1,359
Per the usual, I've been having issues with TSP Blog stats from the AI, so I had to build the table the old school way, this will save some AI resources, and reduce mistakes.
What I find interesting. if you look at the last line, if we factor in inflation then the G-Fund is losing money.
I used the Fisher equation, some nerd method to use nominal interest rates, real interest rates, and inflation.
 G-Fund Estimated Forward Returns [3]
• Daily estimator: +0.0116% per trading day based on recent G-Fund closes.
• Next 5 sessions: +0.058%
• Next month (December): +0.24%
• Next 3 months: +0.73%
• Next Year: around +2.96% based on the current G-Fund path.
 Based on current trailing-12-month inflation rate of 3.01%, real-world G-Fund returns are closer to -0.05% per year. [4]
What I find interesting. if you look at the last line, if we factor in inflation then the G-Fund is losing money.
I used the Fisher equation, some nerd method to use nominal interest rates, real interest rates, and inflation.
G-Fund Estimated Forward Returns [3]• Daily estimator: +0.0116% per trading day based on recent G-Fund closes.
• Next 5 sessions: +0.058%
• Next month (December): +0.24%
• Next 3 months: +0.73%
• Next Year: around +2.96% based on the current G-Fund path.
Based on current trailing-12-month inflation rate of 3.01%, real-world G-Fund returns are closer to -0.05% per year. [4]JTH
TSP Legend
- Reaction score
- 1,359
This it the 4th -3% pullback we've had since the April-Tariff-Crash.
06-Nov -3.08%, 10-Oct -3.16%, 01-Aug -3.33%, 23-May -3.37%
If you recall I keep a rolling 63-LR Window going back 10K sessions, so it's easy to evaluate the current channel.
AI Review - The 63-day channel has been firmly up since late May. It maxed out in strength in July, cooled through August, and
since mid-September it’s been in the same kind of slow, mature climb you’re seeing right now.
- We’re sitting at slope about 7 → uptrend, but well off the “max power” readings of 16 to 17 back in July.
- Dev 55 (Channel's width)→ same volatility regime as mid-September, slightly wider than the really tight early-September 40s, but miles calmer than the 200s in June.
| Possible path | What would cause it | Frequency in similar setups* |
|---|---|---|
| Continued grind higher | Price keeps riding the midline; no volatility spike; slope stays roughly where it is | Most common |
| Short-term pullback inside the channel | Price reaches or overshoots the upper band while slope stays negative (uptrend) | Next most common |
| Full regime shift / flattening | Slope drifts toward 0, Dev begins to expand sharply | Less common, but rising risk the longer slope hovers around 7 without re-steepening |
JTH
TSP Legend
- Reaction score
- 1,359
Heading out of town for the week. It's time to do the annual (and not often needed) snow-tire change. This means I'll will be forced to endure the burdens of my deployable Chromebook work station.
Friday's Session low hit Std Deviation -3.64 on the 63-Session Linear Regression Channel.
A ≤ -3 Deviation has occurred 368 times over 10K sessions making this a bottom 3.68% event.
That's a respectable pullback within this timeframe. At present our Channel has a positive slope angle of 6.89
9-Session Returns after 63LR (STD DEV < -3)

Channel Rising – 9-Session Returns after 63LR (STD DEV < -3)
Channel Falling – 9-Session Returns after 63LR (STD DEV < -3)
All Conditions – 9-Session Returns after 63LR (STD DEV < -3)
Rising Channel + Price > 50/100/200 MA – 9-Session Returns after 63LR (STD DEV ≤ -3)
Friday's Session low hit Std Deviation -3.64 on the 63-Session Linear Regression Channel.
A ≤ -3 Deviation has occurred 368 times over 10K sessions making this a bottom 3.68% event.
That's a respectable pullback within this timeframe. At present our Channel has a positive slope angle of 6.89
9-Session Returns after 63LR (STD DEV < -3)
Channel Rising 61.2% Win Ratio
Channel Declining 1.1% Win Ratio
All Conditions 60.3% Win Ratio
Rising Channel + Price > 50/100/200 MA 54.8% Win Ratio
Channel Rising – 9-Session Returns after 63LR (STD DEV < -3)
| Bucket | Count | Share | Avg 9-Session Return |
|---|---|---|---|
 Winners (return > 0%) Winners (return > 0%) | 172 | 61.2% | 2.35% |
 Losers (return < 0%) Losers (return < 0%) | 109 | 38.8% | -2.57% |
 All signals All signals | 281 | 100% | 0.44% average |
Channel Falling – 9-Session Returns after 63LR (STD DEV < -3)
| Bucket | Count | Share | Avg 9-Session Return |
|---|---|---|---|
| Winners (return > 0%) | 1 | 1.1% | 0.86% |
| Losers (return < 0%) | 86 | 98.9% | -9.37% |
| All signals | 87 | 100% | -9.25% average |
All Conditions – 9-Session Returns after 63LR (STD DEV < -3)
| Bucket | Count | Share | Avg 9-Session Return |
|---|---|---|---|
| Winners return > 0%) | 222 | 60.3% | 2.69% |
| Losers (return < 0%) | 146 | 39.7% | -3.31% |
| All signals | 368 | 100% | 0.31% average |
Rising Channel + Price > 50/100/200 MA – 9-Session Returns after 63LR (STD DEV ≤ -3)
| Bucket | Count | Share | Avg 9-Session Return |
|---|---|---|---|
| Winners (return > 0%) | 57 | 54.8% | 2.27% |
| Losers (return < 0%) | 47 | 45.2% | -2.04% |
| All signals | 104 | 100% | 0.32% average |
JTH
TSP Legend
- Reaction score
- 1,359
I've been on a bit of Rolling Window kick, where a rolling window of data is moving a slice of a larger dataset we then use to measure performance, averages, or statistics over consistent time spans. With the table below I can tell you these past 252 sessions or 1-year of returns are in the Top-40% of 39 years. But, while the current returns seem great, it's not all that impressive within this context.
But since we already knew we had two back-to-back +20% returns from 2023-2024, we see this show up in the 3-year data set, where it ranks in the Top 8% of 37-Years.

AI-Output: Overall picture: this is a strong, healthy tape, not an extreme one.
But since we already knew we had two back-to-back +20% returns from 2023-2024, we see this show up in the 3-year data set, where it ranks in the Top 8% of 37-Years.
AI-Output: Overall picture: this is a strong, healthy tape, not an extreme one.
- All horizons (1, 3, 5, 10 years) show solid double-digit annualized returns, and each ranks better than the historical median, with the 3-year window standing out in the top 8% of the last 37 years – that’s unusually strong but not full-blown mania.
- The win ratios (54–58%) and avg gain vs avg loss are remarkably consistent across horizons, which says the strength is coming from steady, positive drift over time, not just one freak rally.
- Put simply: this says “bullish and resilient, historically above average, but not at absurd blow-off levels.”

JTH
TSP Legend
- Reaction score
- 1,359
New chart stats, I've been having fun with gaps.
This morning the S&P 500 opened -.36%, this places it in Slot-2 the Bottom 10% bucket.
That's a sore spot, showing today's session has a 23% win ratio with a -.74% average return.
3-Sessions after today the stats are lower than the 20-year benchmark, but 6 & 9 sessions after aren't so bad.

Ignore the .76% 1-Session benchmark, it's .04%
This morning the S&P 500 opened -.36%, this places it in Slot-2 the Bottom 10% bucket.
That's a sore spot, showing today's session has a 23% win ratio with a -.74% average return.
3-Sessions after today the stats are lower than the 20-year benchmark, but 6 & 9 sessions after aren't so bad.
Ignore the .76% 1-Session benchmark, it's .04%
Last edited:
JTH
TSP Legend
- Reaction score
- 1,359
I moved into the C-Fund on Monday, but it's mostly a symbolic gesture at this point.
This system I believe may prove useful within the TSP realm, as Slots tend to rotate quickly, but only 23% are a 1-Session transition. Most transitions occur within 4-6 sessions, with the max-session less than 25 over the past 18+ years. This keeps the slot updates frequent enough to matter, but also stable enough to act on within TSP's IFT limits.
We just entered Slot-2 on Tuesday's close.
1-18 Slots, with 1-6 reserved for the Uptrend State.

This project started off because I wanted a way to quantify and measure Breadth vs. Performance. But since I'm using Breadth in a way that does not conform to our perception of it, I'm dubbing it as Sync (the Synchronization of Price and Breadth). With previous systems I worked with forward modeling, this framework is what I call Conditional Modeling, telling us where we sit inside the hierarchy of price structure.
This system I believe may prove useful within the TSP realm, as Slots tend to rotate quickly, but only 23% are a 1-Session transition. Most transitions occur within 4-6 sessions, with the max-session less than 25 over the past 18+ years. This keeps the slot updates frequent enough to matter, but also stable enough to act on within TSP's IFT limits.
We just entered Slot-2 on Tuesday's close.
1-18 Slots, with 1-6 reserved for the Uptrend State.
- Slot strength improves as the State shifts higher, Volatility normalizes, and Sync rises.
- Slot Transitions follow history, showing the most common next Projected Slot from the current phase.
- Just read the purple, that’s what’s relevant for our current condition.
This project started off because I wanted a way to quantify and measure Breadth vs. Performance. But since I'm using Breadth in a way that does not conform to our perception of it, I'm dubbing it as Sync (the Synchronization of Price and Breadth). With previous systems I worked with forward modeling, this framework is what I call Conditional Modeling, telling us where we sit inside the hierarchy of price structure.
Last edited:
JTH
TSP Legend
- Reaction score
- 1,359
Not much to report, if you haven't noticed, volume has been low over the past 5-Sessions.
There are 4 Primary months where volume is low, Jul-Sep, and December.
Sometimes this low volume phase floats deeper into the Mid-Jan MLK Holiday, but not consistently.
From my data and historical expectations.

We are 6-Sessions inside Slot-2, this is a good place to be, Slots 1-18 are ranked by performance per State, with the Top-6 slopts dedicated to the Uptrend phase.

There are 4 Primary months where volume is low, Jul-Sep, and December.
Sometimes this low volume phase floats deeper into the Mid-Jan MLK Holiday, but not consistently.
From my data and historical expectations.
- Holiday Quiet Phase is 15-Dec to 31-Dec
- Where Dec is a low volume phase, Jan is more of a "reset" low risk-taking phase
- As we progress down towards the Bottom 10% Bucket, Win Ratios are higher, as are the average gains.
- But, the Average of Gains & losses are also lower as we progress down to the Bottom 10% of the bucket.
We are 6-Sessions inside Slot-2, this is a good place to be, Slots 1-18 are ranked by performance per State, with the Top-6 slopts dedicated to the Uptrend phase.
- We have been in the Uptrend phase over 131 sessions, and Stable in the Top 20% for 9 sessions.
- Volatility has been Moderate over 38 sessions, and Stable in the Mid 40% for 37 sessions.
- Sync has been Aligned over 6 sessions, and Dropped into the Mid 40% for 2 sessions.
Last edited:
Similar threads
- Replies
- 0
- Views
- 154