JTH's Account Talk

Good morning

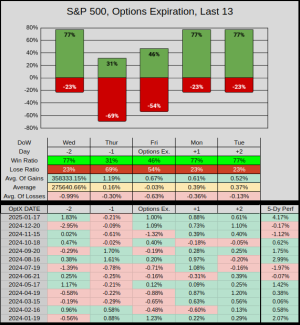
Here's the daily performance surrounding the last 13 Options Expiration.
It's interesting that Thursday has an usually low 31% win ratio, but the last 2 Friday that followed were +1% gainers.
Last January's OptX saw a 5-Day gain of 4.17% where Day +2 was also the January Top (our current YTD High).

Screenshot_2025-02-18_15-06-09.png
 
Good morning

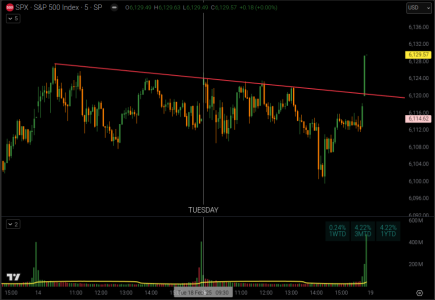
I was fully prepared for an end of day selloff, but that didn't happen. Here's a 5-minute chart showing that in the last 10 minutes of the session, buyers stepped in. At 470.33 Mil, this was the strongest 10-minute volume since the 25-Jan Low (which was 713.1 Mil).

Screenshot_2025-02-19_12-47-03.png


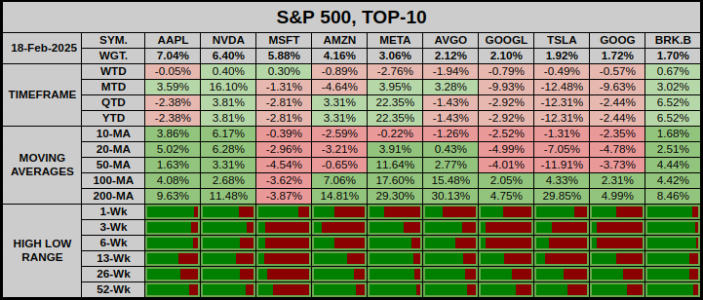
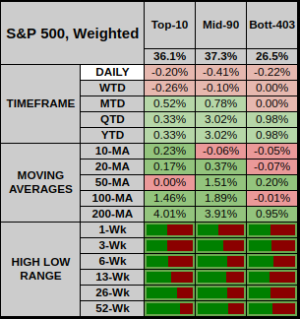
Although the index closed Tuesday positive .24%, 7 of the Top-10 closed the session down.

Screenshot_2025-02-19_12-27-15.png


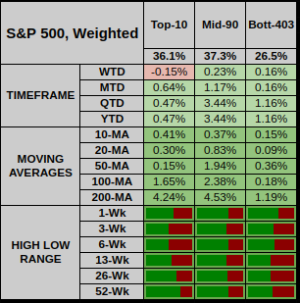
On the weighted scale, we can see that .23% from the Mid-90 did the heavy lifting, while The Top-10 & Bott-403 canceled each other out.

Screenshot_2025-02-19_12-27-26.png


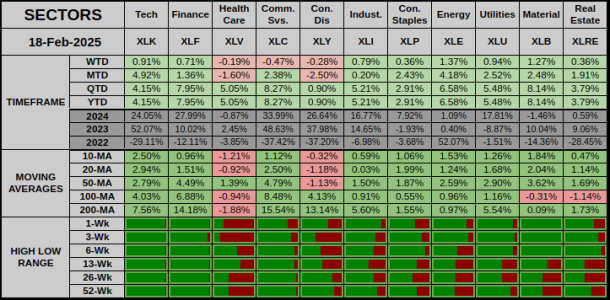
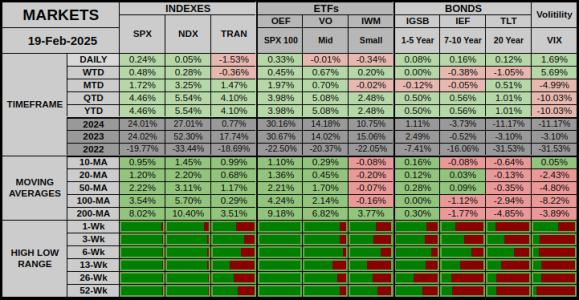
8 of 11 sector ETFs closed positive.

Screenshot_2025-02-19_12-27-39.png


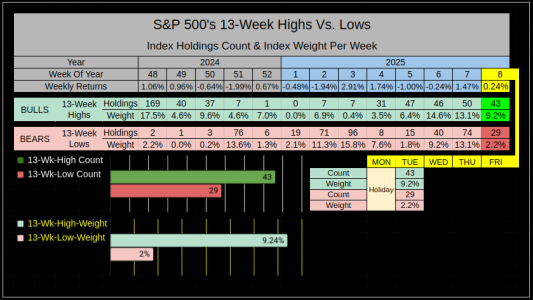
It's a short Week-8, but it's off to a good start. WTD, the Bulls are outpacing the Bears with 43 new 13-Week Highs weighted at 9.24% of the index.

Screenshot_2025-02-19_12-17-40.png


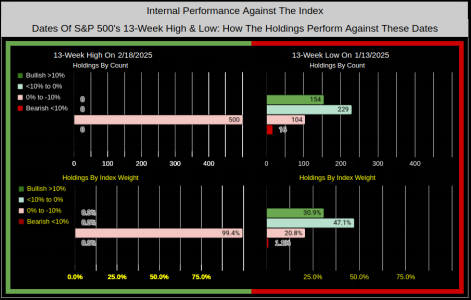
The S&P 500 made a new 13-Week High, this resets the left side of the chart. If the Index does not go higher, (but the internal holdings do) this is where you'll see this data reflected.

In the meantime, for the right side of the chart, we have 154 holdings weighted at 30.9% of the index, which are > 10% above the date of the Index's 13-Week-Low.

Screenshot_2025-02-19_11-38-12.png

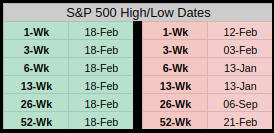
Lastly, we have a fresh set of new highs on the 1/3/6/13/26/52 Week Time-frames.

Screenshot_2025-02-19_14-48-59.png

Have a great week... Jason
 
Last edited:
Good morning

I was fully prepared for an end of day selloff, but that didn't happen. Here's a 5-minute chart showing that in the last 10 minutes of the session, buyers stepped in. At 470.33 Mil, this was the strongest 10-minute volume since the 25-Jan Low (which was 713.1 Mil).

I think "they" wanted that new closing high yesterday.
 
  • Like
Reactions: JTH
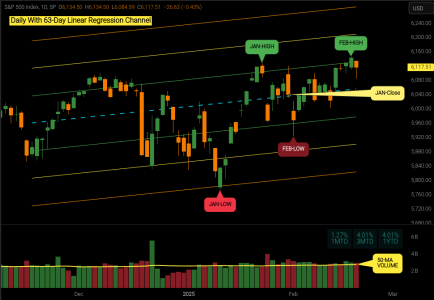
Here's what might be important to consider.

1. January closed positive
2. The February High is higher than the January High
3. The February Low is higher than the January Low

Under those criteria, from the previous 63-Years, this has happened 30 of 63 times.
The result for February was an 80% win ratio with an average gain of 2.90% Vs. a 20% lose ratio with an average loss of -2.34%

But wait! It gets better... Of the 5 times where criteria 1/2/3 were met, but February closed the month down, all 5 years closed positive for an average gain of 16.34%
001.png


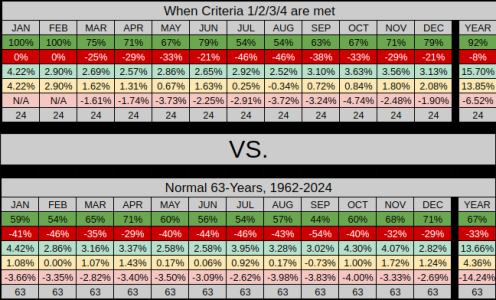
So now we ask the question, what are the results of what happens when the first 3 criteria are met, + February closed higher than January.
This has happened 24 of 63 years where...

1. January closed positive
2. The February High is higher than the January High
3. The February Low is higher than the January Low
4. February closed higher than January

For the following 10 months the monthly win ratios were higher 9 of 10 months (Aug was slightly lower).
Interestingly, the average gains were only higher on 4 of 10 months, but the yearly win ratio and average yearly gains are higher.
002.png
 
The Pre-markets have mostly been up about .50% so it's looking like a retrace day.

In the 5th chart from Where to find the Monthly Low? blog, within the 3 sessions before & after Options X, Day +1 (today) had the most number of monthly lows (within this 7-session timeframe).

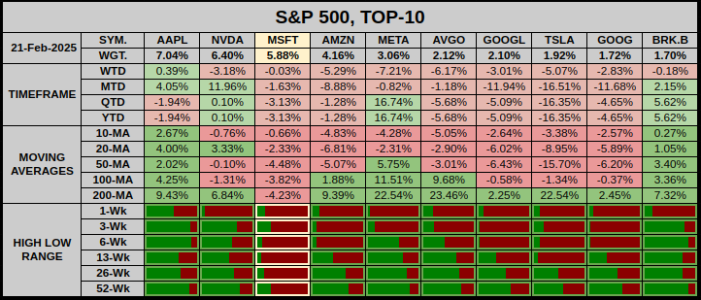
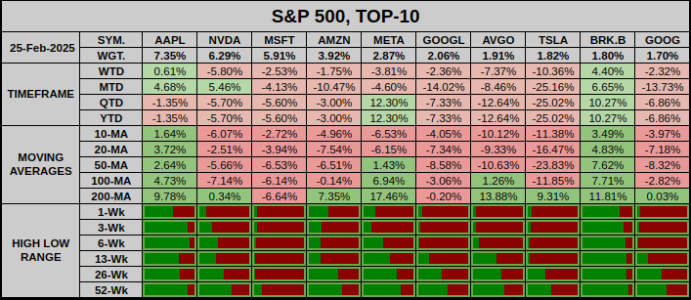
Gotta lotta red on the Top-10, but only Microsoft is deep in the lower range of it's 1/3/6/13/26/52-Week price range.

Screenshot_2025-02-24_14-09-29.png


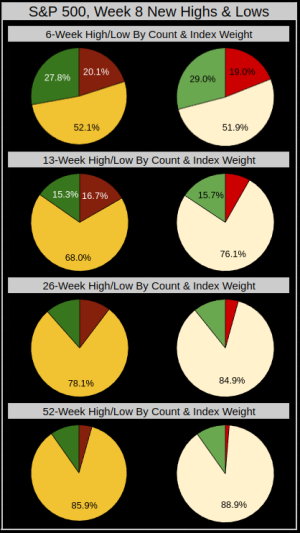
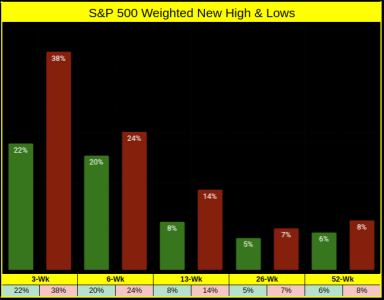
For Week-8, if we look at the Index's holdings on various timeframes & ranges, (as a whole) new-highs still outpace the new-lows, both in count & weight.

Screenshot_2025-02-24_13-05-02.png
 
Last edited by a moderator:
Will we get a 7th consecutive positive Tuesday?

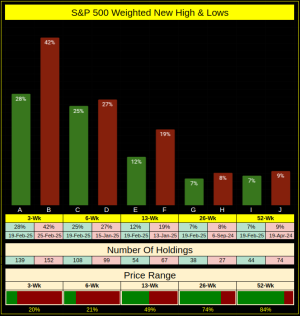
Anyhow, at this moment, on the weighted scale, for Week-9, on all timeframes listed, new lows are outpacing new highs.
From this perspective, the deepest damage is on the shorter 3-Week timeframe.

Screenshot_2025-02-25_12-54-20.png
 
Good morning

Column B shows us a weighted 42% of the Index & 152 Holdings are at new 3-Week Lows. Additionally, the Index is trading at the bottom 20% of it's 3-Week Price range.

Screenshot_2025-02-26_10-55-40.png


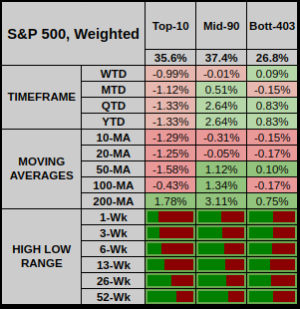
If we sort the index's 503 holdings by weight, we can see the bulk of damage is within the Top-10.
The Top-10 is down WTD/MTD/YTD, and below the composite-weighted 10/20/50/100 Moving Average.

Screenshot_2025-02-26_10-41-13.png


This Top-10 damage can be seen across 8 of 10 holdings.
You would think most of these holdings are within the Tech Sector, but the perception vs. reality is different.
--- Weighted at a combined 21.46%, the Top-3 and Broadcom, are in the Information Technology Sector.
--- Weighted at a combined 5.74%, Amazon and Tesla are in Consumer Discretionary (although Amazon does provide many IT services).
--- Weighted at a combined 6.63% Meta & Google are in Communication Services (whatever)
--- That leaves the good old reliable Berkshire Hathaway in Financials, (green on all timeframes & moving averages).

Screenshot_2025-02-26_10-41-29.png


Just last week, (in the far right column) I added the Volatility Index. The fear Index is in the green (no that's not good).

Screenshot_2025-02-26_10-40-57.png


True Fact: Since DJT recently took office, every SPX Friday has closed down...and Tesla has lost -32.40%
 
Last edited:
True Fact: Since DJT recently took office, every SPX Friday has closed down...and Tesla has lost -32.40%

All DJT Fridays are still down, and Tesla has lost -36.13%, and dropped into the Bottom of the Top-10 S&P 500 stocks.


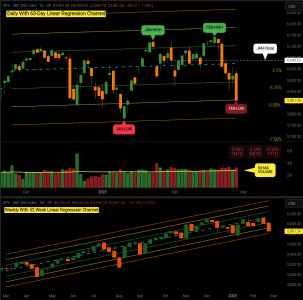
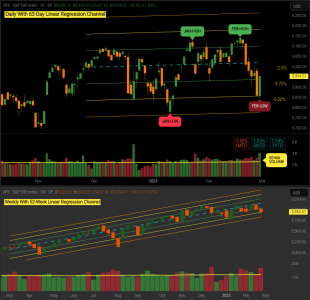
Here's something we don't get to see everyday, the S&P 500's price has closed below Standard Deviation 2 Support, both on the 63-Day and 52-Week Linear Regression Channels.

001.png


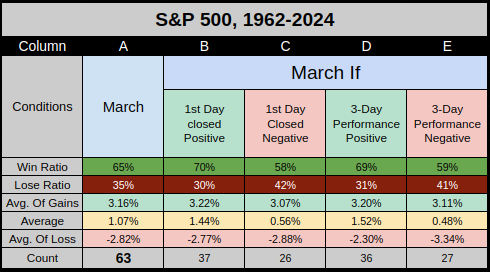
I'll do a March blog this weekend, with a key theme. A bad February does not have much of a negative statistical impact on March's performance.

Have a great "stress-free" weekend... Jason
 
Good morning

I don't usually address the topic of volume, but since I have some unanswered questions, it means I've been working yet another project. I'm researching volume, and how it relates to price projections. It's a bit deeper than I usually go and has been tying my brain in a knot :)

Anyhow, as many of us might summarize, volume was heavy on Friday at the Feb low, and we've pierced some support levels on the 63-Day & 52-Week Linear Regression Channels.

The question...

Is it the swing low?
A continued escalation to the downside?
A fake pump, then another dump lower?
Will we be range bound?

001.png
 
Another glorious day of battle for the markets.

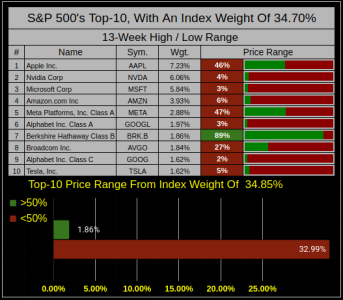
When you're Top-10 of 503 holdings are weighted more than a 3rd of the index, and 9 are less than half of their 13-Week High Low Range.

Ouch...

Screenshot_2025-03-04_14-14-29.png
 
Here's a useless fact

Today's March low is 4 calendar days from the February low.

From 1962-2024, both the Average & Median calendar day distance between 2 monthly lows is 30.

At present, at 4 calendar days we are in the Top .0381% of the 756-Month Low-Low Calendar Day Range.
 
Here's a useless fact

Today's March low is 4 calendar days from the February low.

From 1962-2024, both the Average & Median calendar day distance between 2 monthly lows is 30.

At present, at 4 calendar days we are in the Top .0381% of the 756-Month Low-Low Calendar Day Range.
Hmmm... quick low-to-lower-low = steep negative slope. I knew in my bones this was going to happen (well, not the THIS POTUS guy thing, I prayed that wouldn't happen), but I was thinking/ hoping this (negative sharp slope thing on the charts) would happen in 1 to 4 weeks from now. POTUS tossed some explohwsives on the pile to kick off the avalanche a wee bit prematurely. I bailed on my TSP to G today after jumping more heavily into CSI the day prior thinking I would get good pricing for a little bounce - but I got rolled out (that's how you burn your two ETFs quickly in a month). Elsewhere with some of my brokerage-traded funds I've tightened some sell-stops, sold some weaker-performing equities, bought a couple I think are good value to weather the storms. I also did some modest short-sells of broadly-traded ETFs & bought a couple inverse-ETFs, expecting continued overall down-turn.
... Good luck to us all except those ego-headed big-wigs who cause this stuff, always seem to come out roses, and who side with evil & seem to be trying hard to increase deathrates & cut off freedom in the world at the neck to let it bleed out.
 
Last edited:
  • Like
Reactions: JTH
I bailed on my TSP to G today after jumping more heavily into CSI the day prior thinking I would get good pricing for a little bounce - but I got rolled out (that's how you burn your two ETFs quickly in a month).
... Good luck to us all except those ego-headed big-wigs who cause this stuff, always seem to come out roses, and who side with evil & seem to be trying hard to increase deathrates & cut off freedom in the world at the neck to let it bleed out.

Keeping in mind I'm paper trading TSP, I swear that pesky 2-IFT limit compounded with EoD prices, might be the single largest form of wealth destruction within TSP. Once I realized I was caught in the Feb-downdraft, I estimated I'll need to ride it out (usually that's the right decision) but not this time. A large part of this decision was based purely on the IFT limits.

But on the fun side, when you're confined within a set of unbreakable rules, it makes is more challenging, thus entertaining (for me).
 
Nothing significant to add.

Last night I brought my cash reserves down to 20%, so I did buy into the markets.
At this juncture, I'll need to see lower prices before committing more cash, something south of -7.5%

Today is Friday March 7th.
From 1962, for the March monthly low, 33 of 63 were after Calendar Day March 7th, the average of 63 was March 12th.
16 of 63 March monthly lows fell on a Friday.
 
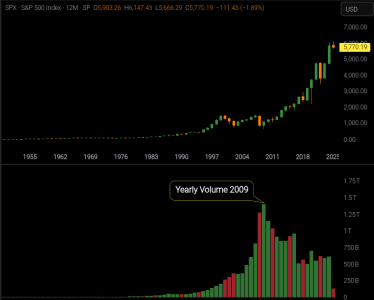
While doing some studies on volume, in order to even the playing field, I've pretty much come to the conclusion I either have to use shorter timeframes (11 years instead of 63) or apply regression to volume. When looking at surges in volume, you really can't compare a 2009 event vs. something that happened back in the 70s.

The chart below is Yearly.

001.png
002.png
 
Back
Top