JTH's Account Talk

Good morning

For some randomness, I'll post a correction chart from previous times. The 67/68 Correction was interesting and we might find some commonalities with 2025. The Sep/Oct top started off with a swift -6.61% pullback which finalized with 7 consecutive sessions closing down. This was the final peak of 1967 which closed the year with a 20.09% gain.

While in 67 the index peaked in September it did work to recover prices giving us a shallow double top fake-out in Jan-68. But this is where the fun ended, with a 35-session decline starting off with 8 consecutive closes down. In totality this was a -10.11% correction which took 110 sessions to fully drawdown, and 37 sessions to recover. One interesting observation, the bottom of this correction was tested 8 times.

Like 2024, 1967's September closed higher than October.
Like 2025, 1968's Feb closed down & March closed down YTD.

1967 Closed up 20.09%, 1968 closed up 7.66%
2024 Closed up 23.31%, with 2025... TBD
Yah, good data exercise & points. Trying to think outta-da-box after reading your post, I realized this.... During BOTH time-periods shown we had fairly major WARs that we should-have PAID for (Viet Nam - no war-bonds or such so it pretty much was covered by increasing the Nat'l. Debt; Ukraine - we were helping to pay for it but perhaps should have paid more, & then we stopped & now not paying much)... also, both had transition of POTUS (ok, I'm off by a year on the election of POTUS #37, but close enough?) - from Elephant to Donkey, with the Democratic candidates a bit conflicted, & the other was/is a criminal who would-have-been/was impeached [but the POTUS #37 won fairly handily I recall, while the #47 claimed a huge majority when he won by the lowest of margins].
 
Yah, good data exercise & points. Trying to think outta-da-box after reading your post, I realized this.... During BOTH time-periods shown we had fairly major WARs that we should-have PAID for (Viet Nam - no war-bonds or such so it pretty much was covered by increasing the Nat'l. Debt; Ukraine - we were helping to pay for it but perhaps should have paid more, & then we stopped & now not paying much)... also, both had transition of POTUS (ok, I'm off by a year on the election of POTUS #37, but close enough?) - from Elephant to Donkey, with the Democratic candidates a bit conflicted, & the other was/is a criminal who would-have-been/was impeached [but the POTUS #37 won fairly handily I recall, while the #47 claimed a huge majority when he won by the lowest of margins].

Some good correlations, I was also thinking about how it led into 1969 and the how the 70s were a wasteland.

1969-79 averaged 1.88% per year.
 
Then 80 to 81 you had mortgage rates jumping to almost 15% and banks/savings & loans being bought and sold almost on a regular basis. I got caught up in that mess just after I got married in 79.
 
Thank you sir may I have another?

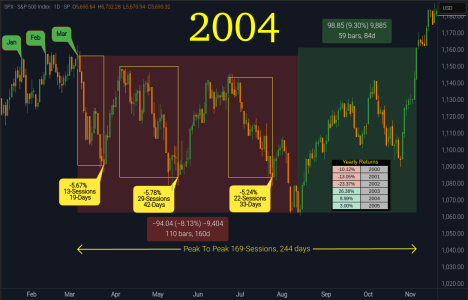
Well above the 2000-2002 Bear Market Bottom (but not fully recovered from the 2000-Peak), here's an extensive Light-Correction from 2004.
Having climbed 41.03% off the May-03 bottom, 2003 had just ended the year with a 26.38% gain, and heading into 2004 we were still making new highs.

So for the setup, Jan-04 had just given us a fresh new high, with Feb & Mar giving us a pronounced V-shaped Double-Top. Although we were still making new highs it was also "perhaps" apparent momentum was declining.

In 13-sessions we processed a swift -5.67% pullback (yea it happens) then headed right back up to re-test the highs only to pullback again with another 29-session -5.78% pullback. Fool me twice shame on you, how about a 3rd -5.24% pullback? Technically speaking we could call this one -8.13% pullback, since we never did recover from the first drop, but gosh darn that must have been a frustrating 110 session drawdown.

Like 2024's 23.31% gain, 2003's 26.38% gain was a double-digit winner.
___For reference, over the past 63 years we've had 3-Triples & 14-Doubles.

Like 2025, 2004 had both a Jan & Feb peak (but 2004 held ground until 4-March).
For 2004's 110-session drawdown, in 2025 terms this would put our yearly bottom at 29-July.
From what I've read/heard, 2025 expectations were to be a sub 10% year, while 2004 closed at 8.99%
001.png
 
Last edited:
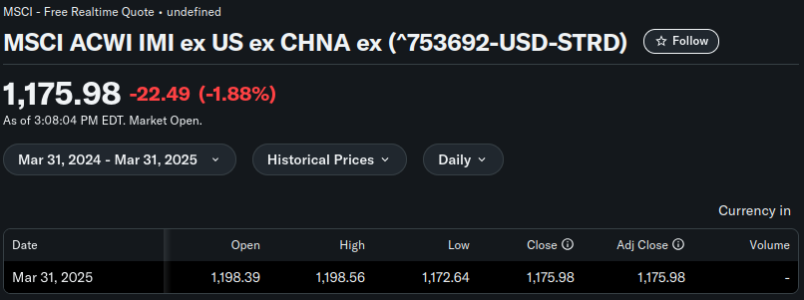
In regards to the I-Fund and it's recent transition into the "Whatever Fund" that tracks MSCI ACWI IMI ex USA ex China ex Hong Kong Index. Frankly the fact they continue to advertise the I-Fund's historical performance under a different fund, is at best misleading.

To date, I can't track it via tradingview, and Yahoo only keeps 1-day of data.
Screenshot_2025-03-31_21-08-41.png

As Craig Johnson puts it.

"I don't think that the world order has changed okay, the world order has been the US innovates, China replicates and Europe regulates and I don't think that that world order has changed despite the tariffs any way you cut it and one of the things that we've done is we've created a very simple kind of uh analysis looking at uh the MSEI all world index EX_US and sort of compared that to the S&P 500 on an annual basis and one of the things that we've sort of interestingly found is...." Starts at 22:22

 
Last edited:
Thank you sir may I have another?

Well above the 2000-2002 Bear Market Bottom (but not fully recovered from the 2000-Peak), here's an extensive Light-Correction from 2004.
.... Like 2025, 2004 had both a Jan & Feb peak (but 2004 held ground until 4-March).
For 2004's 110-session drawdown, in 2025 terms this would put our yearly bottom at 29-July.
From what I've read/heard, 2025 expectations were to be a sub 10% year, while 2004 closed at 8.99%...
OUCH, that 2003-04 comparison with now looks ominous & a bit scary... yet I'd take it -- with the proviso that 2025 doesn't turn out greatly worse than that, which is a fear that I fear is a significant possibility, and if not so this year - then look out for such really tough times in '26-27.
 
That beats my 6:30 am open in PT. :sleep:

Yea I don't miss that timezone, I'm not gonna lie, I crawl out of bed around 9ish, shower, walk the dog, brew the coffee, and usually have the first sip right about the time the pre-markets open.
OUCH, that 2003-04 comparison with now looks ominous & a bit scary... yet I'd take it -- with the proviso that 2025 doesn't turn out greatly worse than that, which is a fear that I fear is a significant possibility, and if not so this year - then look out for such really tough times in '26-27.

For me the worst outcome would be the 2-year 2000-2002 bear market, mostly because it took 5-years to recover from that drop. Since I already have statistical concerns for 2026, I will entertain a plausible 2-year bear market, which is why I'm heavy in cash at 17.5%
 
In celebration of libertardion day we are 89-sessions into DJT's 2nd Term.

Obama 2 has a clearly defined lead with Biden & Reagan 2 on his heels.

If nice guys finish last, then Carter is in the lead. Bush Jr, 1 and DJT 2 are neck-in-neck as the worst.

Screenshot_2025-04-02_14-31-17.png
 
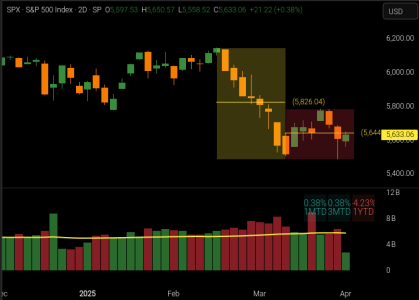
Closes on the left post-market live on the right. That's a hard selloff, I wonder what that looks like tomorrow.....

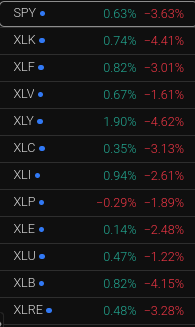
SPX ETF and the 11 SPDR Sector ETFs.

Screenshot_2025-04-03_00-27-07.png
 
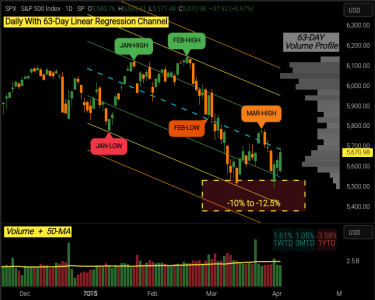
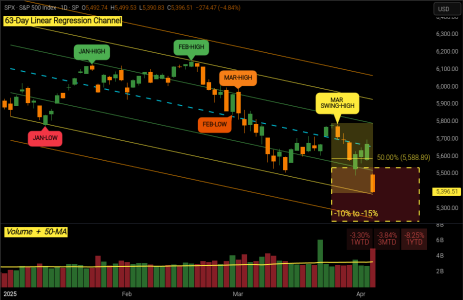
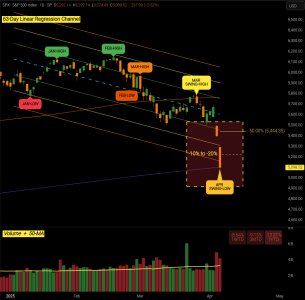
Here's the setup going into Post-Tariff-Meltdown

001.png


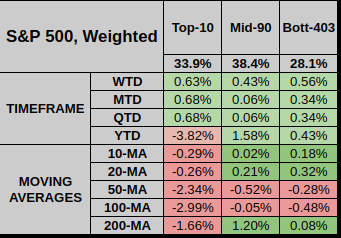
As from the 19_Feb Peak the dominant theme, large-weighted-stocks have taken the brunt of damage.

Screenshot_2025-04-03_11-19-02.png


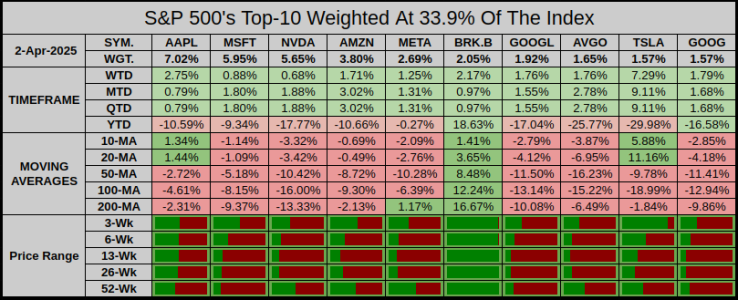
Nothing gives me a bigger smile than seeing old man Warren Buffett's BRK.B smelling like a fresh bed of roses.

Screenshot_2025-04-03_11-19-24.png


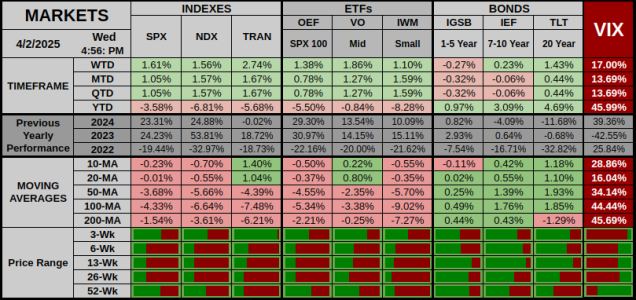
I've modded the VIX by inverting the colors, the theme here "Red is dead"

Screenshot_2025-04-03_11-20-07.png
 
Back
Top