JTH's Account Talk

Good morning

These past few weeks my google spreadsheets (which pull data from google finance), have been unable to load quickly. I've tried switching browsers, and also tried breaking up the spreadsheets into smaller chunks, but nothing has helped. Usually the page just times out and fails to load. If I make a minor change like changing the WTD date, then the whole process starts over. Eventually it does load, but it's becoming a PIA because I prefer to close the browser tabs when they aren't being used.

I may have to consider a complete rebuild, and/or less features.

MTD we have 29 new 52-Week Highs weighted at 15% of the index.
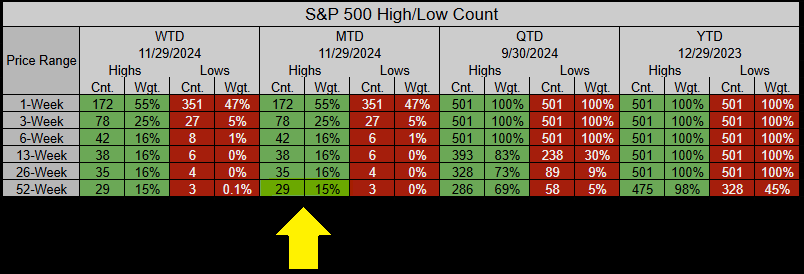
202412-03-002.png

Have a great week.

202412-03-001.PNG
 
Good morning

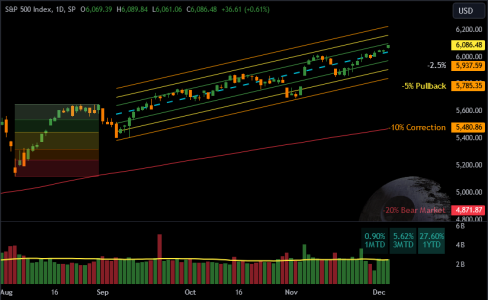
An interesting side-note, the 63-Session Linear Regression Channel (representing a quarter's worth of prices) goes back to the last 24-Sep pullback. Based on this view we are fairly priced and well within the range of acceptable values. Another tidbit, a pullback to the 200 MA would be a -10% correction.

20241205-02.png


Another fun factoid, the S&P 500's 52-Week Low from 7-Dec-2023 is rising and will continue to rise "roughly" until the Apr-2024 -5.91% pullback.

At Present: 273 Holdings are ≥ 20% above their respective 52-Week Lows roughly weighted at 68% of the index.

20241205-01.PNG
 
Good morning

Cruise control engaged, I've re-balanced my holdings, now sitting 25% HYSA cash.

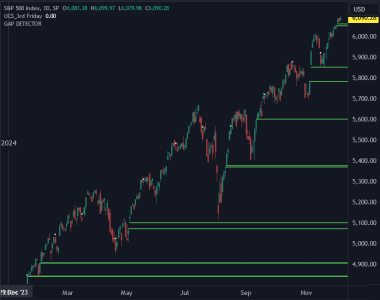
Here are the unfilled gaps in year 2024

20241206-00.png


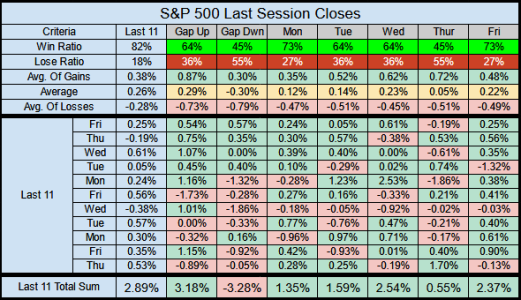
For the past 11 sessions of each Gap & DoW, we are burning coal. 82% win ratio, Mon/Fri at 73% with Wed having the best 11-session gain at 2.54%

20241206-00-01.png


Over the past 63 sessions Monday has both the strongest win ratio & gains.
To put it another way, 36% of the the gains have come from Monday alone.

20241206-00-02.png


Over the past 252 sessions the spread is a bit more even, with Mon/Tue/Fri making up 79% of the gains.

20241206-00-03.png


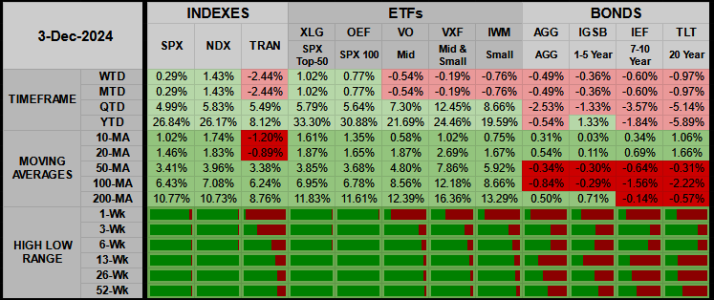
This Week/Month the Transports have been stuttering. We can also see both Tech (NDX) and Large Caps (OEF) are leading the pack. I suppose this is expected as those hedge-fund folks start to position into the final stretch of 2024.

20241206-01.png


Starting off December, we've made 64 new 52-Week Highs, weighted at 26% of the Index.
What's more interesting, 13 of those 64 holdings are in the Weighted Top-50 at 21% of the index.

20241206-02.PNG


Going back on vacation later this month. Once I get the deployed work station setup, I'll start thinking about focusing on a Blog for the 1st quarter of 2025. In the meantime, much of the data I posted in 2024's January Trifecta Blog is still relevant and can be applied going forward into 2025. Have a great week...Jason
 
Good morning and happy Friday

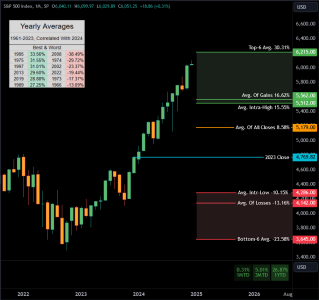
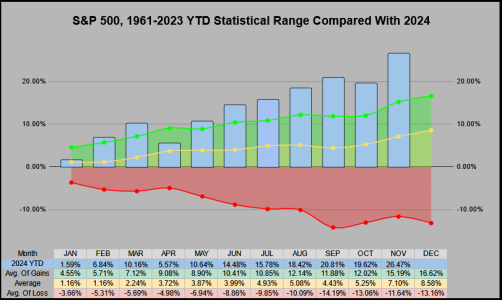
Here are some comparisons for how YTD 2024 compares with it's previous 63-Years of averages.


At 26.87% YTD, 2024 is currently in the upper 13 percentile range when compared with the previous 63-Years.

20241213-01.png


Last November on the YTD timeframe, at 26.47% YTD we ranked 6th best of 64.
From the Top-10 YTD Months of November, 7 Months of December closed higher than the previous November.

20241213-02.png


Have a great weekend... Jason
 
Great chart. I think we all remember 2008, 2013, 2019 & 2022. The 2022 year was my worst year and 2020 was my best. Ah, memories.
 
  • Like
Reactions: JTH
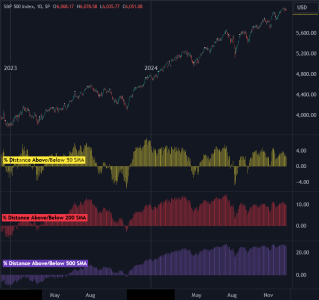
Here's a 2-Year view of the S&P 500 and the percentage of its price above/below the 50/200/500 moving averages. While we are at recent 52-week highs, the the yellow/red/purple columns show we still have more room for upside before eclipsing previous % > SMA highs.

20241216-00.png


The S&P 500's Top-50 ETF XLG is up a whopping 35.60% YTD.

20241216-01.PNG


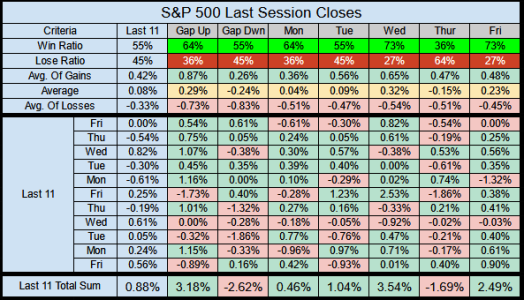
Although we've closed down the last 4 of 7 sessions, we still have a 55% 11-session win ratio.

20241216-02.PNG


Have a great week!
 
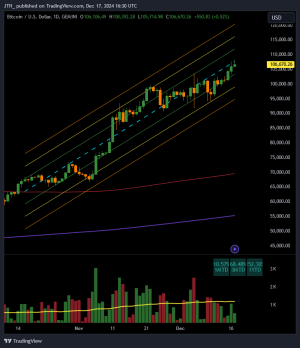
Happy to report I'm out of Bitcoin at 106,900K.

I have no idea how high or low it will go, but the 63-Session Linear Regression Channel shows a range from 95K to 120K with the 200 SMA at 70K

BTCUSD_2024-12-17_17-30-02.png
 
Some interesting observations.

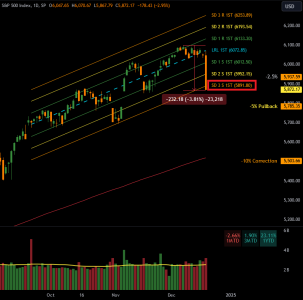
-- Off the S&P 500's 6-Dec 52-Week High, we've retraced -3.81%.
-- Closing the session down -2.95% this is the strongest down day since the 5-Aug-2024 -3.00% swing low.
-- From 1961-Present, 172 of 16,133 sessions closed down ≤ -2.75% (this is a 1% occurrence).


We've closed below Standard Deviation Support 3 within the 63-Session Linear Regression Channel. This doesn't happen often, according to the empirical rule, price should be confined within SD 3 Support 99.7% of the time. We would have to go back 95-sessions to confine Wednesday's close above SD-3 (which is 1-session shy of the 5-Aug Swing Low).

20241219-00.png


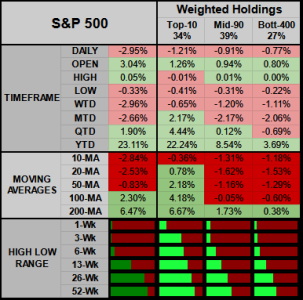
A look at the S&P 500 from a weighted prospective shows us about 42% of Wednesday's -2.95% loss came from the Weighted Top-10.
But from a moving average perspective, we can see the Mid-90 & Bottom-403 are below their weighted 10/20/50/200 MAs.

20241219-01.PNG


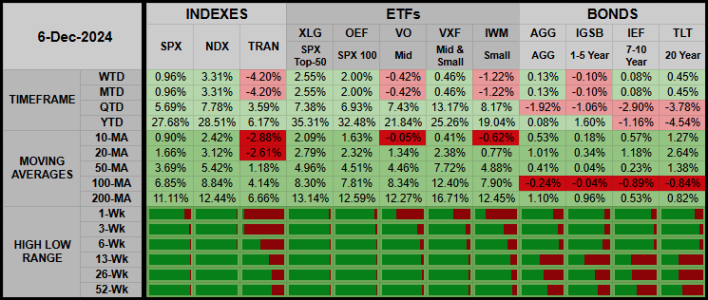
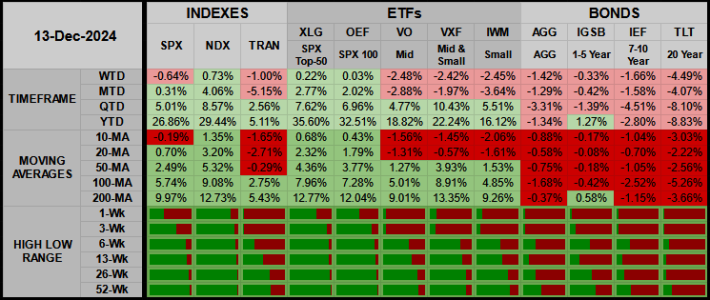
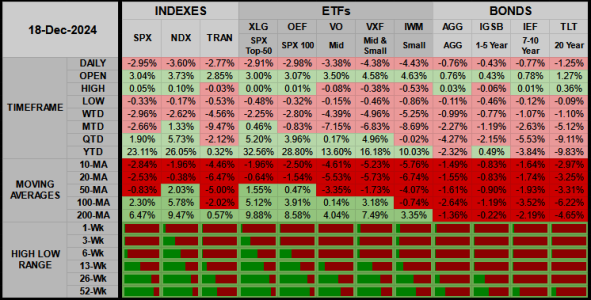
While Wednesday's selling was broad-based, we can see the the Mid & Small Cap ETFs ( VXF & IWM) took the biggest hits.
Looking at the High/Low range the Color-coded red/green bars show us almost everything is at the bottom of its 3-week high/Low range.

20241219-02.PNG


This chart can be difficult to interpret without explanation.

This week or WTD, of the S&P 500's 503 holdings, 411 have made new 3-Week lows. Those 411 holdings are weighted at 58% of the index.

20241219-03.png


Have a great day... Jason
 
Well -- okay then.... if you're gonna put it like that.
HaHa... I am still hoping for some HoHoHo from the Markets, starting right-- about-- Now(?).

I have to admit, since I've already re-balanced and am heavy on cash, some dip buying would be nice.

If today gaps down hard at the open....

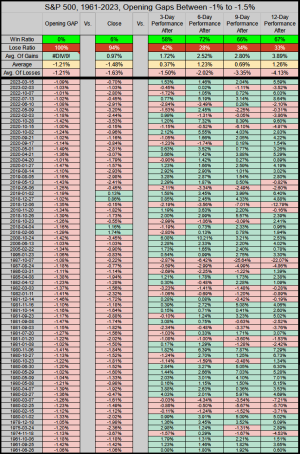
Over the previous 63-Years, the S&P 500 has gaped down at the open -1% to -1.5% only a handful of times.
Of those 67 events, the day's closing win ratio was 6%, but the 12-session performance after has a 67% win ratio.
Basically, 67% of the time we will close higher 12-sessions after the gap down.

Of the 67 Gaps down at the open, 48 closed the session lower that day. So "in theory" buys have a 72% chance of getting a lower price at the close.


20241220-01.png
 
Last edited:
I have to admit, since I've already re-balanced and am heavy on cash, some dip buying would be nice.

Of the 67 Gaps down at the open, 48 closed the session lower that day. So "in theory" buys have a 72% chance of getting a lower price at the close.
Would be nice if we could do real time trading. Unfortunately, we are stuck guessing what will happen four hours before it does.
 
Would be nice if we could do real time trading. Unfortunately, we are stuck guessing what will happen four hours before it does.
To JTH's last posting: Well, I'm not looking at the overnight pricing, tho C & S funds at least looked to have been dipped somewhat below yesterday's closing prices - and went up quickly from there... So, there seemed to have been some "dip" that was tradable. Hope you were able to jump on that early for some dip-buying (assuming Santa-rally at least is now started - charts look like they're sustaining their gains so far today): tho I'm sure it is tough to real-time our USA East-coast markets from Poland... it is hard enough for me on our Western USA CONUS-coast to get up and on the PC looking at the markets by 0630 (with the 3-hr behind difference from NYC time).

To NASA1974: Yes, it is quite pathetic that we can't - not even closely - do real-time trades w/TSP; not only as you said (one trade per day with noon-Eastern time deadline), but worse that one couldn't play something like today's early morning bounce. Then add to that our having only two effective trades per month... a very old gripe on this TSPtalk site!

Oh well. Happy Holidays / Season's Greetings / Merry Christmas to you all with wishes for many blessings to you too.

(Kurt / also "FAAM" [somehow had to reregister with my email and all since Tom changed over the programming for this site... think I might be registered twice now - a small mess].)
 
(Kurt / also "FAAM" [somehow had to reregister with my email and all since Tom changed over the programming for this site... think I might be registered twice now - a small mess].)
So, here I post again with my "original" TspTalk membership...
Would be nice if we could do real time trading. Unfortunately, we are stuck guessing what will happen four hours before it does.
To JTH's last posting: Well, I'm not looking at the overnight pricing, tho C & S funds at least looked to have been dipped somewhat below yesterday's closing prices - and went up quickly from there... So, there seemed to have been some "dip" that was tradable. Hope you were able to jump on that early for some dip-buying (assuming Santa-rally at least is now started - charts look like they're sustaining their gains so far today): tho I'm sure it is tough to real-time our USA East-coast markets from Poland... it is hard enough for me on our Western USA CONUS-coast to get up and on the PC looking at the markets by 0630 (with the 3-hr behind difference from NYC time).

To NASA1974: Yes, it is quite pathetic that we can't - not even closely - do real-time trades w/TSP; not only as you said (one trade per day with noon-Eastern time deadline), but worse that one couldn't play something like today's early morning bounce. Then add to that our having only two effective trades per month... a very old gripe on this TSPtalk site!

Oh well. Happy Holidays / Season's Greetings / Merry Christmas to you all with wishes for many blessings to you too.

(Sorry, but me and computers don't usually get along too well.)
 
(Kurt / also "FAAM" [somehow had to reregister with my email and all since Tom changed over the programming for this site... think I might be registered twice now - a small mess].)

I sent both accounts a private message. We'll straighten it out.
 
Good morning

This weekend I'd like to do a blog for 2025 projections.

Lately, I've been in a rabbit hole, working towards removing myself from Windows & Google as much as feasible.
Some of this was fueled by the impending End of Life Support for Windows 10, thus having to upgrade to Windows 11.
The other annoyance is Google's multiple attempts to break Ublock Origin, I refuse to watch Youtube ads.

While I'm mostly a Firefox user, when running on a Windows Host with Linux Virtual Machines, the performance has been slower than Chrome.
So I've switched over, I'm now running a Linux Host with Linux Virtual Machines, and I'm pleased to report the performance is significantly better.
In addition, once I've acclimated, I expect my work flow to be smoother & faster.

Anyhow, Happy New Year!
 
Good morning

I'm not one to preach doom & gloom, but sometimes it's fun to imagine what could happen if we had a substantial Bear Market correction.

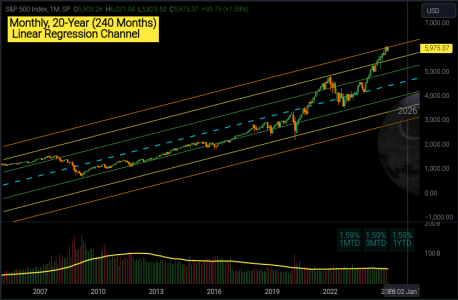
This Monthly 20-year Linear Regression Chart shows just how overbought the index was at the top. At December's 52-Week High, we pierced the orange Standard Deviation Resistance 3 line. The Blue-Dashed LRL line or "fair value line" resides at SPX 4425.85.

At current levels, to get back to fair value, we would need to retrace -26%.

20250107-01.png
 
Good morning

I'm not one to preach doom & gloom, but sometimes it's fun to imagine what could happen if we had a substantial Bear Market correction.

This Monthly 20-year Linear Regression Chart shows just how overbought the index was at the top. At December's 52-Week High, we pierced the orange Standard Deviation Resistance 3 line. The Blue-Dashed LRL line or "fair value line" resides at SPX 4425.85.

At current levels, to get back to fair value, we would need to retrace -26%.

View attachment 67623
Ouch
 
  • Like
Reactions: JTH
Good morning

I'm not one to preach doom & gloom, but sometimes it's fun to imagine what could happen if we had a substantial Bear Market correction.

This Monthly 20-year Linear Regression Chart shows just how overbought the index was at the top. At December's 52-Week High, we pierced the orange Standard Deviation Resistance 3 line. The Blue-Dashed LRL line or "fair value line" resides at SPX 4425.85.

At current levels, to get back to fair value, we would need to retrace -26%.

View attachment 67623
Just an observation. Interesting to see, by your chart, how the market has reacted during the current administration.
 
Back
Top