Re: Friday
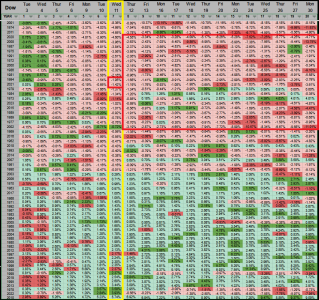
How might the statistically poor seasonality over the next couple weeks play into your statistical crystal ball (skewed some by it being POTUS election year)?
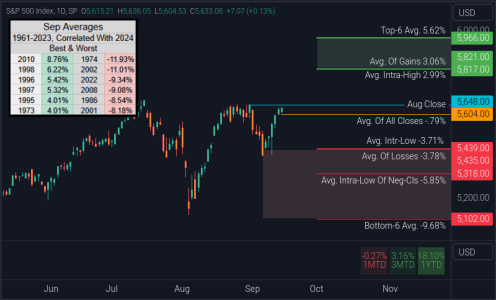
It's a tough nut to crack, 5 of the last 6 Octobers (during Presidential Cycle 4) closed down, but only 2008 was bad. Then there's this fiscal budget issue creeping into the headlines. If September's levels hold, (and the 3-month performance is positive) then the 4-Month performance closes higher about 58% of the time. Maybe the most important thing to consider, we now have a higher low & and a higher high.
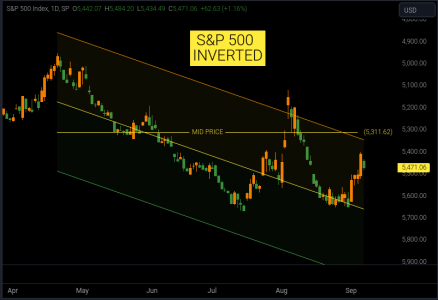
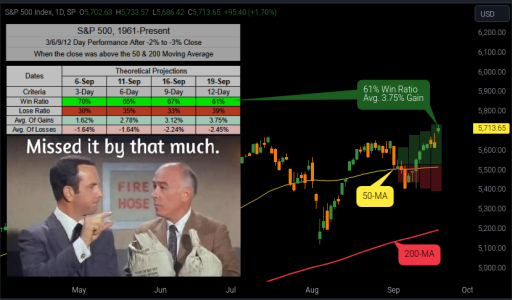
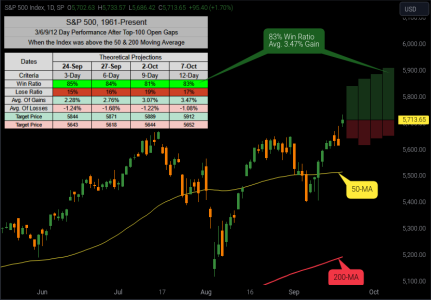
I still believe my projected SPX High of 5888 is doable, and (from the previous post/projection) we could get there in the next 12-sessions. If that happens, then at that point I suspect the markets will need to cool off for the remainder of October. Either ways this is a very unique time with lot's of crosscurrents, I just want to get through the election unscathed.
[TABLE="width: 0"]
[TR]
[TD="bgcolor: #d9d9d9, align: center"]Year[/TD]
[TD="bgcolor: #d9d9d9, align: center"]Month[/TD]
[TD="bgcolor: #fce8b2, align: center"]1-M[/TD]
[/TR]
[TR]
[TD="bgcolor: #efefef, align: center"]2020[/TD]
[TD="bgcolor: #efefef, align: center"]Oct [/TD]
[TD="bgcolor: #f4c7c3, align: center"]-2.77%[/TD]
[/TR]
[TR]
[TD="bgcolor: #efefef, align: center"]2016[/TD]
[TD="bgcolor: #efefef, align: center"]Oct [/TD]
[TD="bgcolor: #f4c7c3, align: center"]-1.94%[/TD]
[/TR]
[TR]
[TD="bgcolor: #efefef, align: center"]2012[/TD]
[TD="bgcolor: #efefef, align: center"]Oct [/TD]
[TD="bgcolor: #f4c7c3, align: center"]-1.98%[/TD]
[/TR]
[TR]
[TD="bgcolor: #efefef, align: center"]2008[/TD]
[TD="bgcolor: #efefef, align: center"]Oct [/TD]
[TD="bgcolor: #f4c7c3, align: center"]-16.94%[/TD]
[/TR]
[TR]
[TD="bgcolor: #efefef, align: center"]2004[/TD]
[TD="bgcolor: #efefef, align: center"]Oct [/TD]
[TD="bgcolor: #b7e1cd, align: center"]1.40%[/TD]
[/TR]
[TR]
[TD="bgcolor: #efefef, align: center"]2000[/TD]
[TD="bgcolor: #efefef, align: center"]Oct [/TD]
[TD="bgcolor: #f4c7c3, align: center"]-0.49%[/TD]
[/TR]
[TR]
[TD="bgcolor: #efefef, align: center"]1996[/TD]
[TD="bgcolor: #efefef, align: center"]Oct [/TD]
[TD="bgcolor: #b7e1cd, align: center"]2.61%[/TD]
[/TR]
[TR]
[TD="bgcolor: #efefef, align: center"]1992[/TD]
[TD="bgcolor: #efefef, align: center"]Oct [/TD]
[TD="bgcolor: #b7e1cd, align: center"]0.21%[/TD]
[/TR]
[TR]
[TD="bgcolor: #efefef, align: center"]1988[/TD]
[TD="bgcolor: #efefef, align: center"]Oct [/TD]
[TD="bgcolor: #b7e1cd, align: center"]2.60%[/TD]
[/TR]
[TR]
[TD="bgcolor: #efefef, align: center"]1984[/TD]
[TD="bgcolor: #efefef, align: center"]Oct [/TD]
[TD="bgcolor: #f4c7c3, align: center"]-0.01%[/TD]
[/TR]
[TR]
[TD="bgcolor: #efefef, align: center"]1980[/TD]
[TD="bgcolor: #efefef, align: center"]Oct [/TD]
[TD="bgcolor: #b7e1cd, align: center"]1.59%[/TD]
[/TR]
[TR]
[TD="bgcolor: #efefef, align: center"]1976[/TD]
[TD="bgcolor: #efefef, align: center"]Oct [/TD]
[TD="bgcolor: #f4c7c3, align: center"]-2.22%[/TD]
[/TR]
[TR]
[TD="bgcolor: #efefef, align: center"]1972[/TD]
[TD="bgcolor: #efefef, align: center"]Oct [/TD]
[TD="bgcolor: #b7e1cd, align: center"]0.93%[/TD]
[/TR]
[TR]
[TD="bgcolor: #efefef, align: center"]1968[/TD]
[TD="bgcolor: #efefef, align: center"]Oct [/TD]
[TD="bgcolor: #b7e1cd, align: center"]0.72%[/TD]
[/TR]
[TR]
[TD="bgcolor: #efefef, align: center"]1964[/TD]
[TD="bgcolor: #efefef, align: center"]Oct [/TD]
[TD="bgcolor: #b7e1cd, align: center"]0.81%[/TD]
[/TR]
[/TABLE]
