JTH's Account Talk

Good morning

I think some folks like me, would like to see the USD pullback, but perhaps I'm a bit foolish on how soon that will happen. Here's a Monthly USD chart showing where USD is (Yellow Dotted Line) and how long prices have stayed this high during the early 2000s and 1980s.

DXY_2022-10-20_14-33-16.png


Good morning

This is somewhat amusing :)


-From top to bottom we've lost -27.54%
-From bottom to top, if we regain 27.54% we are still down -7.59%
-To get back to the top from the bottom, we need to gain 38.01%

SPX WEEKLY

SPX_2022-10-21_11-55-56.png
 
Good morning

For some fun, listed below is a percentage/time overlay of 3 previous bear markets which both led to a recession, and were longer than our current 273 days (9 Bars/Months).

SPX MONTHLY:

View attachment 55837

So the thought is that if this bear market plays out like either of those last three, the bottom will be sometime between June 2023 and August 2024?
 
So the thought is that if this bear market plays out like either of those last three, the bottom will be sometime between June 2023 and August 2024?

Yes, it's a perspective of how long it may take before we bottom out. I have no idea where the bottom will go, or when we will get there. For me, it's a reminder to hold more cash then normal, and trickle buy my way in.
 
If one believes that we may have at least 8 more months of this Bear market heading down, would you consider putting TSP money into a fund that shorts the S&P like GSSFX using the mutual fund window? I feel like trying to hit short gains with our two IFTs into C, S or I is very hard to do and if the overall trend is likely down for the next 8 months, it makes sense to be in something that provides gains in a down market? I look at autotracker and see that very few (usually less than 30) are beating the G fund in any given month, let alone the year. Your charts on what kind of increase it takes (38%) to recover from the loss (27%) is sobering. Far better to miss some of the upturn than ride it all the way down? Thanks for posting!
 
If one believes that we may have at least 8 more months of this Bear market heading down, would you consider putting TSP money into a fund that shorts the S&P like GSSFX using the mutual fund window? I feel like trying to hit short gains with our two IFTs into C, S or I is very hard to do and if the overall trend is likely down for the next 8 months, it makes sense to be in something that provides gains in a down market? I look at autotracker and see that very few (usually less than 30) are beating the G fund in any given month, let alone the year. Your charts on what kind of increase it takes (38%) to recover from the loss (27%) is sobering. Far better to miss some of the upturn than ride it all the way down? Thanks for posting!

Thanks, I don't short, partially because there is not a long-term edge, and I don't want to pay short-term capital gains.

The 38.01% reference does not factor in compounding, for myself, I have 14 positions that are down anywhere from 10-24% so when we breach support levels, I just lower the cost basis. In my situation, (retired) I just want to keep myself in the lowest tax bracket possible. Really my goal isn't to beat the markets per say, but to survive them intact and have buying power in the event we have a 2009 type of event.

As for TSP, I'm stuck in the "dead zone" I'm 49, I can't contribute and I can't withdrawal.
 
Good morning

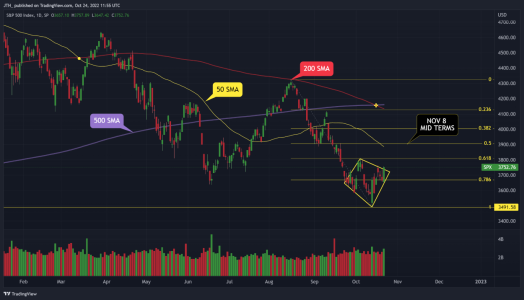
I was looking at the daily SPX and thinking it resembled a Diamond pattern, this was confirmed by Thomas Bulkowski, in his Monday Briefing. Although I find chart patterns fascinating, I don't trade them, but it is nice when they provide confirmation of what you're already thinking.

SPX DAILY
SPX_2022-10-24_13-55-18.png
 
Ok, I guess I didn't know TSP.gov's website is jacked up. By my calculations, as of today, I'm actually down -19.56% YTD

Is there anything else wrong I should also be looking for?

The ytd starts when the site transitioned so ~ May.
Not only are they technologically inept, but the English language seems to be beyond their grasp as well.

But hey, fees went up, so they know how to make money.
 
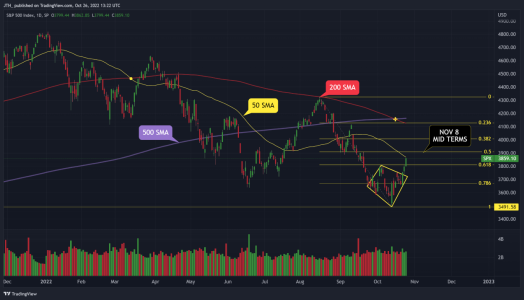
In the short term, if we rise into the November elections, then I'll look to exit around SPX 3900 (50% retracement & 50 SMA), either fully exiting into the G-Fund, or exiting from the S-Fund. Either ways, I want to be out of the S-Fund this month, I don't want to swing trade more than 1 fund at a time.
Good morning

We are close enough to a 50% retracement, so it's a good time for me to reduce my exposure to the S-Fund. If we continue to climb into the end of the month, then I may scale back further into the G-Fund.

IFT From 20G/40C/40S to 25G/75C EoB today.


SPX_2022-10-26_15-22-35.png
 
FACEBOOK META with a $30 dollar gap down. I'm indifferent to see a fall like this, I'm not a buyer at any level.

META_2022-10-27_17-47-55.png
 
Good morning and happy Friday :)

Fresh out of IFTs sitting 25G/75C and watching from the sidelines.

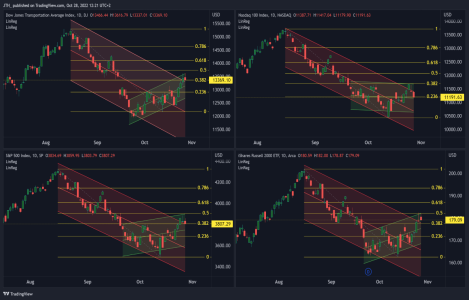
For the overall health of the stock markets, I still like the track the Transports, NASDAQ 100, S&P 500 & IWM Small caps. From Mid-August, we have both Fibonacci levels and a 52/21 day linear regression 2-deviation channel, all on the same point of reference.

From this perspective, we've failed to recapture a 50% retracement, and we are overbought on the 52/21 day channels. Price is telling we should go lower to equalize with the channels, adding to this, I'm not sure what catalyst exist to push prices higher from here.

SPX_2022-10-28_12-21-31.png


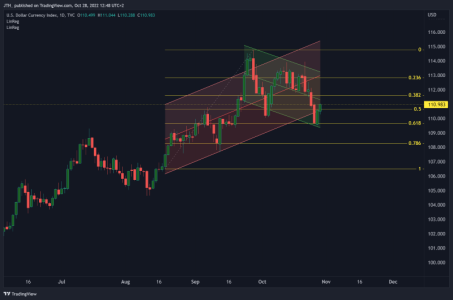
From the same perspective, we have USD which is oversold and still appears inversely correlated with the stock markets.

DXY_2022-10-28_12-48-48.png
 
Good morning

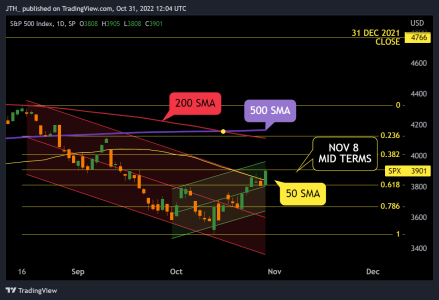
October has had a great run. Thus far, off the 12 day bottom, we've climbed nearly 12% and closed above the 50 SMA for the first time since 9 Sep (36 days).

It's conceivable we could eek out another 5% and test the 200 SMA. That's where I'll look to exit into the G-Fund, then re-enter at a lower price point. But if we instead go lower, then at the Fibonacci .786 level, I'll look to buy more C-Fund.


SPX_2022-10-31_13-04-23.png
 
Good morning

Per the 2021 Stock Trader's Almanac, November is the start of the Best 6 months of the year, and the S&P 500's 2nd best month since 1950. The Russel 2000 also has strong statistics, but only goes back to 1979.

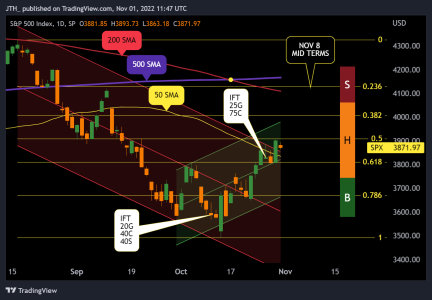
Here's an updated chart with my most recent IFTs, and where I might plan to Sell/Hold/Buy.


SPX_2022-11-01_12-40-50.png
 
Good morning

Over the past 875 Months, 194 of them opened below the Daily 500 SMA. The results below show the statistical average of how those 194 months closed.


SPX-500-AVG-MONTH.png
 
Good morning (Same theme, different SMA)

Over the past 875 Months, 260 of them opened below the Daily 200 SMA. The results below show the statistical average of how those 260 months closed.


SPX-200-AVG-MONTH.png
 
Good morning

Wrapping up this theme, here we have the 72 Months of November.

In November 1987 prices were below both the 200/500 SMA and lost -8.53%

In November 1973 prices were below the 500 SMA and lost -11.39%


SPX-500-AVG-NOVEMBER.png
 
Good morning

This is a short statistical view which covers the closing prices for each Day of the Week over the the past 213 trading days. Overall, these stats do not look good and are definitely under their long-term average.


SPX-500-AVG-DOW.png
 
Back
Top