-
The Forum works well on MOBILE devices without an app: Just go to: https://forum.tsptalk.com
-
Please read our AutoTracker policy on the IFT deadline and remaining active. Thanks!
-
$ - Premium Service Content (Info) | AutoTracker Monthly Winners | Is Gmail et al, Blocking Our emails?
Find us on: Facebook & X | Posting Copyrighted Material
-
Join the TSP Talk AutoTracker: How to Get Started | Login | Main AutoTracker Page
You are using an out of date browser. It may not display this or other websites correctly.
You should upgrade or use an alternative browser.
You should upgrade or use an alternative browser.
DreamboatAnnie's Account Talk
- Thread starter DreamboatAnnie
- Start date
WorkFE
TSP Legend
- Reaction score
- 535
We really need a market rally.
That depends who you ask. Back in November (21) we were getting S Fund shares for $90 a pop.
They are on sale right now for $60

Time is your friend and your enemy.
DreamboatAnnie
TSP Legend
- Reaction score
- 1,042
Agree Boghie! I actually believe inflation or recession will not turn around immediately with political change, due to time it takes to get energy updates executed.
But, a change like that with promise of friendlier business environment would greatly help sentiment and the market before solid changes actually happen. As for investing in any fund, only thinking to enter for a few day pop. So I am thinking very short-term entries and not thinking to stay in longer until we get above 50 MA.
Wishing you and everyone the best!.
But, a change like that with promise of friendlier business environment would greatly help sentiment and the market before solid changes actually happen. As for investing in any fund, only thinking to enter for a few day pop. So I am thinking very short-term entries and not thinking to stay in longer until we get above 50 MA.
Wishing you and everyone the best!
. Beware the 'Ides of F'.
Bonds are priced mostly by math. When the FED jacks the FED Rate by a point the price of the existing bonds in the F-Fund will dump. If that happens (pure math) then there will be some panic selling. However, in bonds, that panic doesn't last.
Like you say, there is nothing out there to revive stock prices. What business is going to risk major investment in this environment. Unlike your belief, I don't know if things will 'immediately' recover because of a political turnover. There may have to be a long period of business friendly policies before capital investment revives. I think we will actually see capital investment pullback in a major way soon.
Keep your powder dry. The 'F' gets an 'F' in periods of inflation. Our problem is the equities (C/S/I) get an 'F' in periods of recession - and I think we have both!!!
DreamboatAnnie
TSP Legend
- Reaction score
- 1,042
LTJPED, Thank you for providing link to Tom's post of mutual funds now offered by TSP. I like the Excel doc. I downloaded it and can search it best.
Big Thank you to Tom as well! I guess I missed it. :smile:
Big Thank you to Tom as well!
I guess I missed it. :smile:
DB here is the link to Tom's post for those MF's: https://www.tsptalk.com/mb/tsp-talk...-tsp-mutual-funds-autotracker.html#post673251
I think someone was talking about getting into an energy MF back when TSP opened back up. I'd be curious if they made a little money since energy seemed to be doing pretty well through June. I'm not dabbling yet. I'm not educated enough to start so until then it's the basic funds for me.
Good discussion in the thread by the way. I think the markets yesterday sold off with that initial data from CPI but sellers got exhausted but then again after getting some buyers stepping in they faded as well. Maybe it was more of a digestion day, plus toss in PPI today I believe, more earning reports, and still markets on edge with what FOMC decision will be later this month. Maybe the markets were saying let's hold our horses and wait for more data before breaking one way or another.
Today looks to be different. Follow through to the downside this morning so far, markets haven't even opened. So who knows where we may end up by COB. I'm getting the itch to dip my toes but the markets could be moving pretty violently the rest of this month. Don't want to be on the wrong side. I've got my popcorn ready and looking for the opportunities. G for now as well for me, unless of course we get some crazy selloffs that would make me raise my eyebrows.
DreamboatAnnie
TSP Legend
- Reaction score
- 1,042
Thank you Felix. Very good points! I agree and I will need to go back and look at the 72-75 period. :smile:
DB has it right in my opinion. While the bear rally’s will come and go…the downtrend will likely continue into 2023 as recession, inflation, and even slowing and then negative job growth begins to enter the picture.
If we pattern the similarities between 1972-1975 where rising inflation and FED intervention began to put a brake on the economy…well…that really made a mess of things even after the first year of big losses. Russia/pandemic influences brings us to even closer parity to the 1972-1974 beating or the 2007-2008 severe beating. I believe it is safe to assume that the damage to the stock market is far from over and the economy is going to be slowing in the first half of 2023. I’m going to factor in the baby boomer pulling out of the stock market because they are retiring in bigger numbers. I’m also going to factor in Gen X which are more likely to stay into the market no matter what since they have lived by the mentality that time is on their side. Therefore…a slow stepdown for the year will become more erratic into 2023 as the recession worsens. So that shoe to drop is coming but the grind down we are seeing will painfully continue until the whammo late this year or in first half of 2023. If an exterior event occurs like Russia backs off Eukraine …that couId change the timeline. I estimate the markets will begin rebounding in earnest before June of next year. Maybe May at the earliest. It is also possible that 2023 continues to be ugly all year if the Russia/covid situation does not back off. We are certainly in a bad pickle right now and the FED will have a very hard time saving the stock market from more pain to come. This is going to be a long road to recovery. Perhaps recovering recent highs by 2025 at the earliest. There is evidence right now we are in a recession (We officially will verify this by the end of July). Retail stores are already in recession mode to increase sales to bring down increasing inventories. I don’t see us escaping this time so easy.
DreamboatAnnie
TSP Legend
- Reaction score
- 1,042
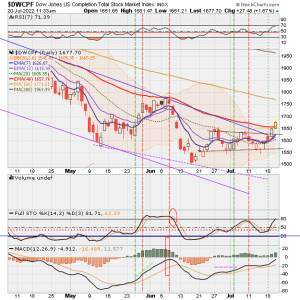
Charts as of a few mins ago. Great counter rally! But not yet made up losses earlier this week, except F fund. But who know...maybe stock continue up next week if earnings surprise to upside or people just get more confident. Wishing you all a great weekend! :smile:


DreamboatAnnie
TSP Legend
- Reaction score
- 1,042
Charts! . My system indicates entry time but bollingers tight and overhead resistance seems too close. Might be good for day or so. I am not entering. I Fund looks best. F fund turning down.


. My system indicates entry time but bollingers tight and overhead resistance seems too close. Might be good for day or so. I am not entering. I Fund looks best. F fund turning down. DreamboatAnnie
TSP Legend
- Reaction score
- 1,042
Great points. Thank You Tommy IV! I have been eyeballing the recent gaps too...never know when they will be filled! :smile:
DreamboatAnnie
TSP Legend
- Reaction score
- 1,042
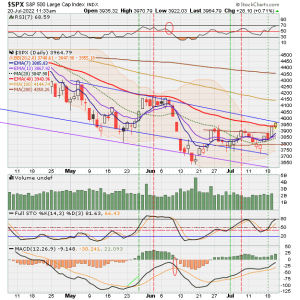
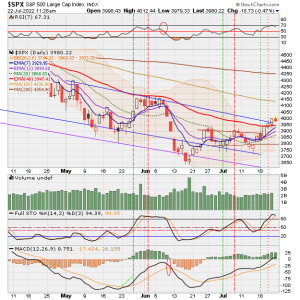
Charts as of a few mins ago. I guess the entry I saw yesterday was correct call. Thought about it again today as price has not yet caused Slow Sto to reach 80. But its a big up day at this point. So, no go for me. Today, S and C funds are both breaking through the swing highs of late June and early July. So, it is breaking through the range bound area. Will see if it continues tomorrow, or drops back down into range.  Next resistance is upper Bollinger and 50 EMA. The dollar continues to move down and helping stocks.


Next resistance is upper Bollinger and 50 EMA. The dollar continues to move down and helping stocks.DreamboatAnnie
TSP Legend
- Reaction score
- 1,042
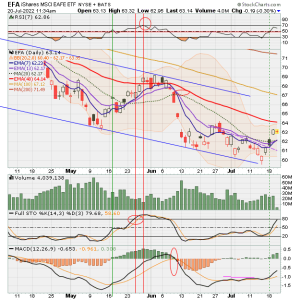
Charts. Awesome follow through! Today would be first day to reduce exposure or exit per my strategy, if in market.


Deleted charts below as the ones above show reduced exposure or exit, and ones below do not.
Today would be first day to reduce exposure or exit per my strategy, if in market. Deleted charts below as the ones above show reduced exposure or exit, and ones below do not.
Attachments
DreamboatAnnie
TSP Legend
- Reaction score
- 1,042
Charts!


DreamboatAnnie
TSP Legend
- Reaction score
- 1,042
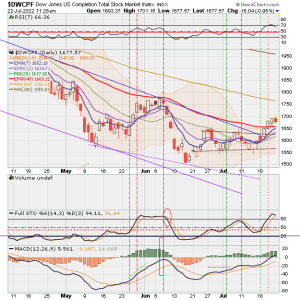
Charts. Indicators getting close to full exit for S and C funds, if still in. Will see if Slow Sto crosses below its signal line by COB or on Monday. RSI already crossing down below 70, which is a sign to exit per my criteria. I probably should have marked charts with 2nd vertical red line to indicate this but must admit I would like to see Slow Sto cross below its own signal before a full exit.
Revised. I am putting in 2nd red line or full exit. Drop below RSI 70 is too pronounced to ignore on S and C fund charts.


Deleted below charts to revise S &C
Revised. I am putting in 2nd red line or full exit. Drop below RSI 70 is too pronounced to ignore on S and C fund charts.
Deleted below charts to revise S &C
Attachments
Last edited:
felixthecat
TSP Analyst
- Reaction score
- 43
- AutoTracker

I should of exited yesterday. Out at close of today. Still a nice bear rally run. No hope of clawing back to even by the end of the year. Looking for second have meltdown starting in second half of this year. 

Charts. Indicators getting close to full exit for S and C funds, if still in. Will see if Slow Sto crosses below its signal line by COB or on Monday. RSI already crossing down below 70, which is a sign to exit per my criteria. I probably should have marked charts with 2nd vertical red line to indicate this but must admit I would like to see Slow Sto cross below its own signal before a full exit.
Revised. I am putting in 2nd red line or full exit. Drop below RSI 70 is too pronounced to ignore on S and C fund charts.
View attachment 54998
View attachment 54999
View attachment 54994
View attachment 54995
Deleted below charts to revise S &C
DreamboatAnnie
TSP Legend
- Reaction score
- 1,042
Hi Felix, I can see that meltdown coming. Will see if it possible to successfully negotiate the short upward countertrends to make some coin this year. I missed the last entry (fear), so now waiting for the next one. Wishing you and everyone the best! :smile:
Last edited:
DreamboatAnnie
TSP Legend
- Reaction score
- 1,042
Good morning, here are charts before noon cutoff. Today, see full exit for F fund if I were in it. I fund still hanging on. :smile:


DreamboatAnnie
TSP Legend
- Reaction score
- 1,042
Charts - so I fund is now also a full exit. They all are. Best wishes to everyone!


Now I fund is out.


Now I fund is out.
DreamboatAnnie
TSP Legend
- Reaction score
- 1,042
Here are charts. I did not have a chance to upload earlier...work, work, work! 


