DreamboatAnnie
TSP Legend
- Reaction score
- 851
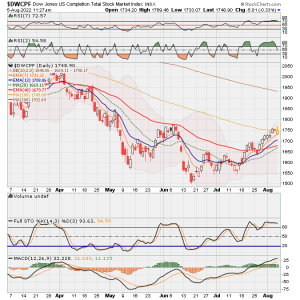
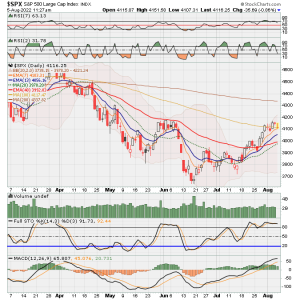
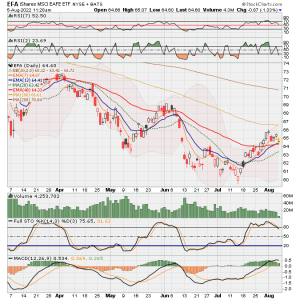
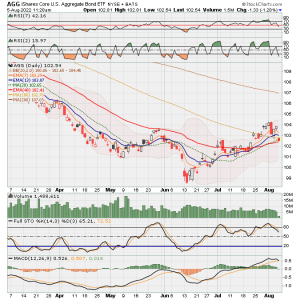
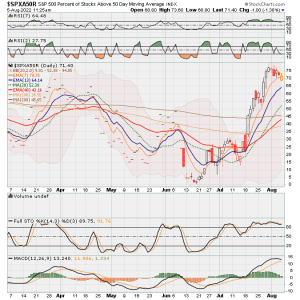
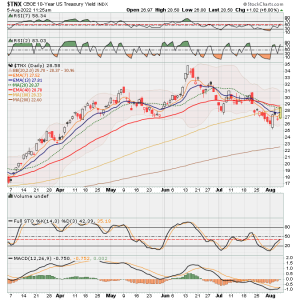
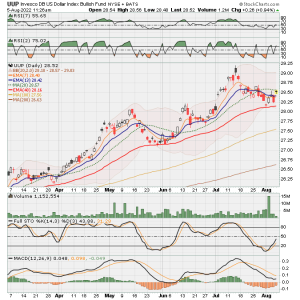
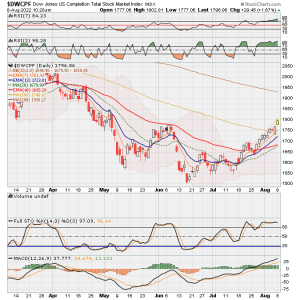
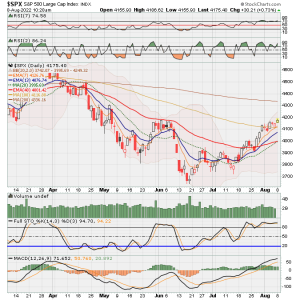
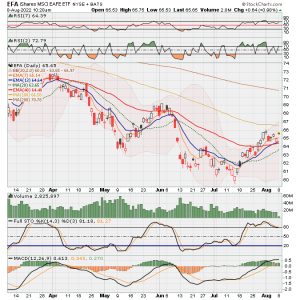
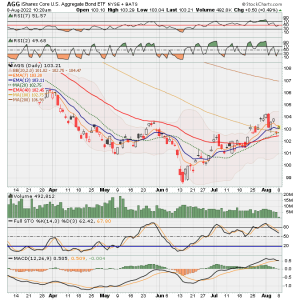
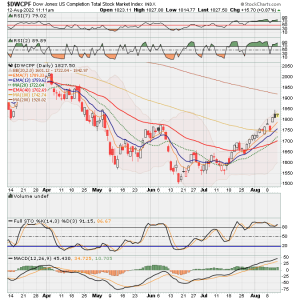
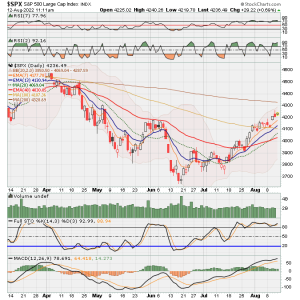
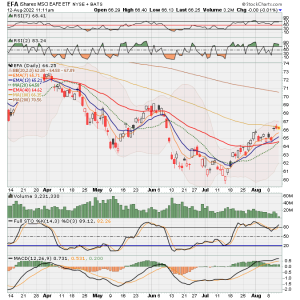
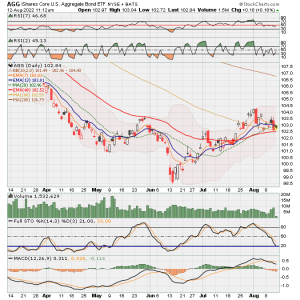
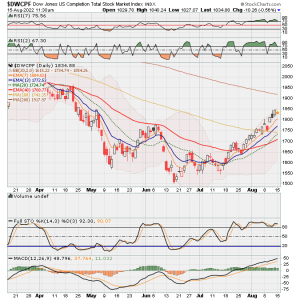
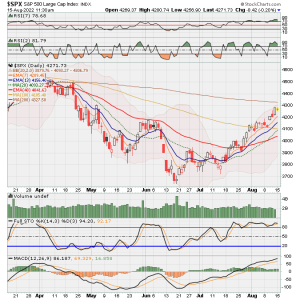
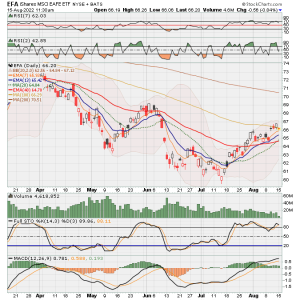
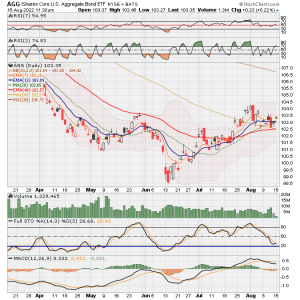
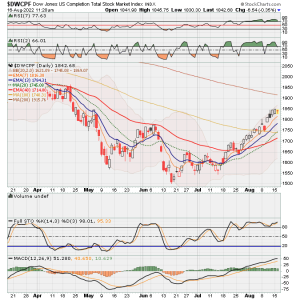
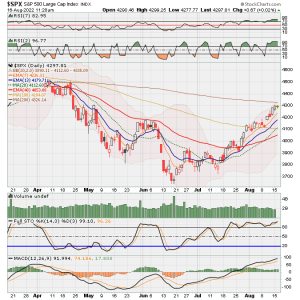
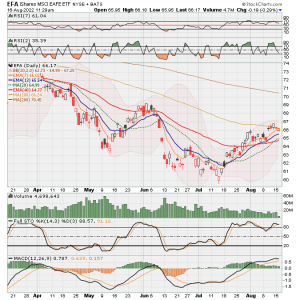
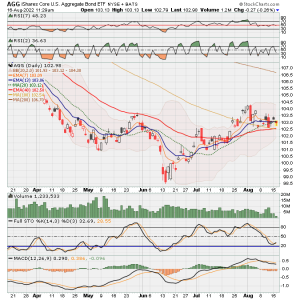
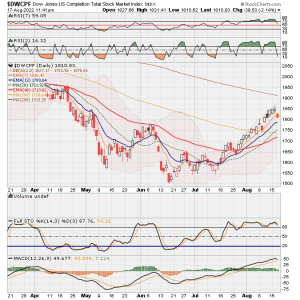
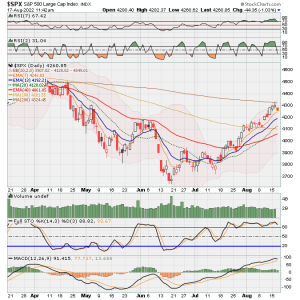
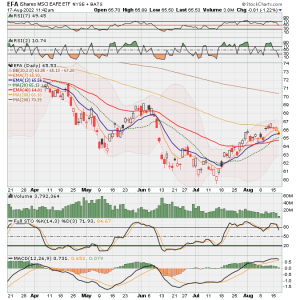
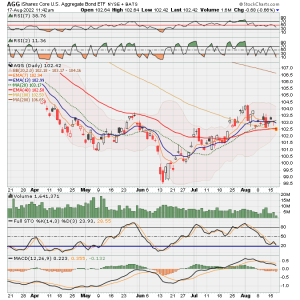
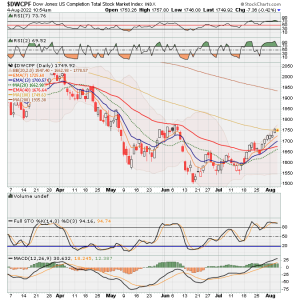
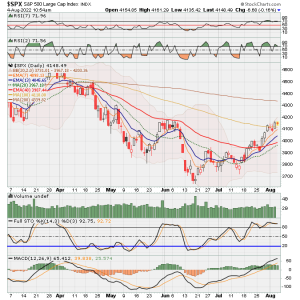
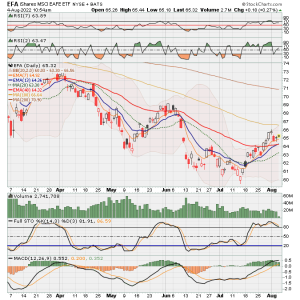
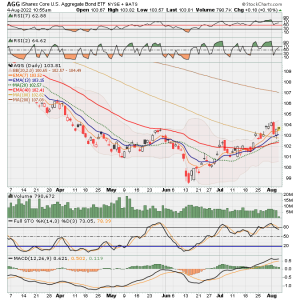
Posting charts a bit early. Decided to get rid of all the lines. I am still keeping them updated and maybe post them every now and then.
What I am now clearly seeing is that the 13 EMA crossed above the 48 EMA a few days ago! That is an entry signal for some. The 13/48.5 Crossover is a longer-term entry/exit method I read about on internet years ago. This group had done studies going back many years and provided figures to show that following this method long-term gave the best returns. Interesting! Has me wanting to enter. :33: But, I will likely try to wait for a small pullback. Also noticing 20day MA is about to cross above 50 EMA. Will it cross up?
https://www.newtraderu.com/2019/08/29/the-best-back-tested-trading-strategies-with-moving-averages/


