DreamboatAnnie's Account Talk

I am exiting. Really don't want to but if I exit, I get to pocket some gain and I'm not ending this month with nothing. Don't really see any indicators changing. Still think it will be a W and go back up. Also, looks like it could be forming bull flag pattern..... Still in a bull market, but our last high was lower than February high, so just not sure of direction. I need to regroup, reconsider my strategy going forward. This exit is in line with current strategy. I will try posting charts daily.

Best wishes to you all!
 
Last edited:
I forgot about noon... So I'm still in.. Oh well.. Easy come easy go.. Again, I've lost way more money being out than being in so.. Who knows.. Good luck everyone.. Don't do what I do.. Lol
 
Charts. Looks better now than it did this morning.
S fund seems to be holding around the 20 SMA (Bollinger band mid-point).
S fund has lower high and a slightly higher low ...price near the BB mid-point so seems to be looking for direction... so neutral.
C fund is better with higher high and apparent higher low with today's candle.

Best wishes to you all!

Dwcpf.png

SPX now.png
 
Last edited:
While not shown on chart above, checkout this chart.... the price has dropped below 50 Simple moving average on S fund (lime green dotted line). Also, looks like 20 SMA is close to crossing below 50 SMA (not yet crossed).
That is considered by some to be a significant cross over. However, many pros say you should not use a single indicator/crossover for moves.
https://tradingsim.com/blog/50-day-moving-average/


Dwcpf.png
 
Last edited:
While not shown on chart above, checkout this chart.... the price has dropped below 50 Simple moving average on S fund (lime green dotted line). Also, looks like 20 SMA is close to crossing below 50 SMA (not yet crossed).
That is considered by some to be a significant cross over. However, many pros say you should not use a single indicator/crossover for moves.
https://tradingsim.com/blog/50-day-moving-average/


View attachment 48734
Good Chart! I bookmarked it for use. I see that the only two sectors that are positive today are consumer staples and utilities. All other sectors are in the red. That smells bad for the market going forward for me since I am pairing this with market advancer/decliners and New Highs/New Lows which have all been pivoting to Kramer's SELL...SELL...SELL. LOL. Feels like a dead cat bounce is coming...but to me it is an opportunity to sell sell sell. Market top is in and I'm going to call it here. Think we will flounder around but in the end...believe rates and inflation are going up. Bigger correction on the way after a dead cat bounce. We may meander around for a few weeks...then the big drop.
 
Market top is in and I'm going to call it here. Think we will flounder around but in the end...believe rates and inflation are going up. Bigger correction on the way after a dead cat bounce. We may meander around for a few weeks...then the big drop.

Quite the call there. S&P hasn't even broke the 50 DMA yet and we're top calling.

Increased cases, new lockdowns in Europe, delayed openings elsewhere, Astra Zeneca concerns all weighing on markets right now. In addition, a bit of superstition from those who think it will magically end because we're right around the one year anniversary.
 
Yep, you are right there! I'm going with my long term experience which is telling me that easy money is gone now that borrowing rates are climbing. I'm thinking the sell catalyst...or shock to the market will be unsustainable corporate debt levels. It will be a big hindrance for future market growth. Servicing that debt will be market headwinds going forward. I can think of a few companies showing some cracks...GE...F...AT&T for example. I would think this problem would manifest on a larger scale overseas first...but would not be surprised to see a few rear their ugly head here in the US. :)
 
Good points. I am being cautious. Trying to stick with strictly reading charts, but I listen to business news (like Kudlow's new show on Fox Business News). In any case, talk of more huge spending bills, increasing taxes and especially taxes placed on businesses/corporations/capital gains does mean less capital for companies to invest in their own business building and infrastructure and hiring. That is definitely not good for business growth GDP, etc. So, tax increases on business and increasing taxes on wages (I.e. social security wages) means everyone will be affected....translates to lesser spending. So, seems like a great formula for slowing growth and for businesses to be apprehensive about putting more money into their businesses or starting new businesses. Eeeeeeeee....:(

Also, as interest rates go up, our Government will need to pay much more interest on our massive debt that is accumulating. Couple that with decreasing working population/(less base to tax). Couple that with possibility that foreign governments (I.e. China) could suddenly decide to stop buying our US Treasury bond issuances to fund the massive spending and raise money to pay interest on existing bonds/debt. Also, higher interest will increase the cost of persons buying homes, cars, etc and raise cost to corporations and businesses borrowing money. Less income for corporations due to less spending on larger items. Sounds like a perfect storm.
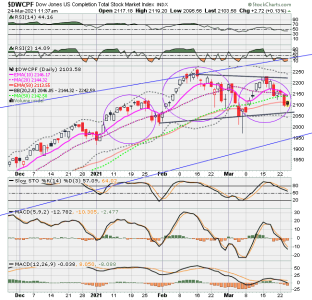

Now back to charts -
DWCPF has made a lower high, and lower low. So, its a short-term trend down. Short-term because we are still in a Bull market until we're not. So, I am now moving towards a bear strategy (shorter entry/exits) but only due to the expected increased volatility.

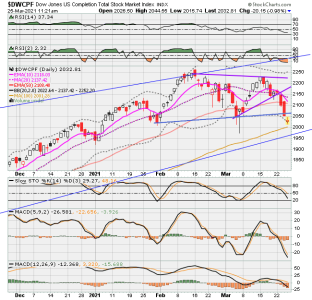
SPX (S%&P 500) recently made a new high. So that is good. Looks like it could go up a little further. But do need to keep eye on the rising wedge. I understand that is bearish once we get near the end of that formation, then drop and restart. Will see...
 
Last edited:
Here are COB charts.

A couple weeks back, I posted charts (post 3433) indicating DWCPF looked like it was starting to form a right shoulder of a Head & Shoulders pattern (bearish). It's now looking more like that right shoulder is finalizing. IF true, it would likely drop more. I guess we will see.

Best wishes to you All* !!!!

Dwcpf.png


SPX now.png
 
Last edited:
I would be careful here. IF...IF...IF its a true head and shoulder there could be more pain. Price might drop below the neckline. Dark line is the neckline and next support line.
It has not reached that point.

Dwcpf.png
 
Last edited:
Charts
Placed 100 day SMA and Fibonacci on S fund. I don't know a lot about fibs rarely use them but does seem like 100 SMA is next level of support. Also close to fib retracement 38.2 level.


Dwcpf.png

Tried to delete the below repeat charts, but would not delete.
 

Attachments

  • Dwcpf.png
    Dwcpf.png
    38 KB · Views: 182
  • SPX now.png
    SPX now.png
    36.1 KB · Views: 183
Back
Top