DreamboatAnnie's Account Talk

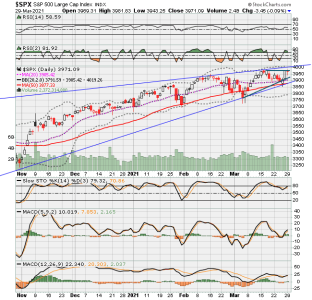
Looks good, especially with the Fibs in there. My WAG is we test the 100 SMA if not today maybe tomorrow as it is Friday.
Lower still to maybe even test the wick that posted on March 5th. More chop if and when it may move up? New resistance
levels on the way up.
 
DBA- thanks for all u o in the forum...lots of us look forward to reading your daily analysis...do u think this is a deadcat bounce happening? Curious for your interp
E
 
Not many dead cats since recovery started. Wouldn’t mind if it is since I’m out of moves til 4/1.


Sent from my iPhone using Tapatalk
 
DBA- thanks for all u o in the forum...lots of us look forward to reading your daily analysis...do u think this is a deadcat bounce happening? Curious for your interp
E

Hi Shitepoke, Not sure if it's a DCB. Certainly due for one. I could argue both ways, but quite honestly I don't know. My gut says DCB, and then lower mid-next week when talk of taxes and more spending starts and if the situation at Suez canal doesn't resolve. I heard it should be couple days to get clear, but possibility it could be a few weeks???? geez, what's up with that...but not hearing that timeframe widely reported. So maybe its untrue.

On daily chart, I still see what looks like H&S (bearish) plus under 50 Day MA, and the 20SMA is crossed below 50SMA. One rule I try to observe is to not be in market when 20MA is below 50MA, unless I see what I think is a bottom and decide to re-enter... a bit risky if its a DCB. So, I'm looking for a true bottom (hopefully) and would need a couple more days to see if indicators turn more.

Looks like market turned up around 10:45 am ET. S fund closed just above the neckline. Futures are up a bit right now. So that is good! A couple more strong days up would likely convince me to re-enter, but I must wait for IFTs to renew in April.

Best wishes to you and Everyone! :smile:

Dwcpf.png

Dwcpf.png
 
Last edited:
Daily Charts COB. Wow! C Fund is killing it! Still watching S Fund. Also looks Very good!

Best wishes to you All* !!! Time to enjoy the weekend! :D :D :D

Dwcpf.png

SPX now.png
 
Looking at weekly chart - S fund. Even with that pendant forming, the last two weeks have been down...but more importantly the MACD default 12.26.9) just crossed below its signal line. Really not liking that because it is the slower moving of the two MACDs I use. Nope I don't like it!
 
Hi KB, I like it better than S fund right now, but not sure I would enter even if I had an IFT. I am watching. C fund looks like it may break out upward, but not thinking it would be strong up thrust only because Stocgastic did not drop below 20 during last swing low. So, I am watching it... looking for break above that green upper trendline. Best wishes to you and everyone! :smile:

SPX now.png
 
COB Charts

S fund - Price held near support on the lower short term trendline (dark green)

Dwcpf.png


C Fund - Stopped right at resistance on the upper short term trend line (dark green). Good.... can it pop through? If so, it would then to go up through a longer term (blue) trend line.
Dwcpf.png
 

Attachments

  • SPX now.png
    SPX now.png
    35.5 KB · Views: 214
Last edited:
Loving the market action today! C Fund broke thru green upper trend line and S fund higher as well. Not at my computer so no charts til later. I am wondering what happens when new Infrasture spending is announced later today. But more importantly, will be looking for market reaction when tax increases are announced.... not sure when that part will be announced. Doubt it happens today... hummm.
 
Here is a link to Stock Charts, Public Charts, market momentum strategy called "Above The Green Line". I have looked at this over the years and really like it. Methodology is explained.

If you click on Chartbook View, you will see a gray area appear at left that says 01 Get Your Edge. Click on that drop down to navigate directly to specific chart your interested in as opposed to scrolling through them all. I like reviewing 04, 10, 54, 57, 60, 65, 79, 99 and ZZH.

https://stockcharts.com/public/1107832
 
Last edited:
Looking to enter today. With yesterday's price action, I see higher high, and a higher low formed (look at 6 last candles) on both S and C fund charts. Action starting out good today for both S and C fund, so just need to decide which to enter.

Best wishes to you all! :D:D:D
 
Looking to enter today. With yesterday's price action, I see higher high, and a higher low formed (look at 6 last candles) on both S and C fund charts. Action starting out good today for both S and C fund, so just need to decide which to enter.

Best wishes to you all! :D:D:D

Why not do a little of each??? :rolleyes:
 
Looking to enter today. With yesterday's price action, I see higher high, and a higher low formed (look at 6 last candles) on both S and C fund charts. Action starting out good today for both S and C fund, so just need to decide which to enter.

Best wishes to you all! :D:D:D

Thanks for that new link you sent for Above the Green Line. Just curious about getting in too and now conflicted because both the IWM and SPY on that site are in the Red Zone which would be a sell?
 
Looking to enter today. With yesterday's price action, I see higher high, and a higher low formed (look at 6 last candles) on both S and C fund charts. Action starting out good today for both S and C fund, so just need to decide which to enter.

Best wishes to you all! :D:D:D

Same situation. But is S headed for good times or will dip when yields spike back up. Undecided.


Sent from my iPhone using Tapatalk
 
Thanks for that new link you sent for Above the Green Line. Just curious about getting in too and now conflicted because both the IWM and SPY on that site are in the Red Zone which would be a sell?

Same situation. But is S headed for good times or will dip when yields spike back up. Undecided.


Sent from my iPhone using Tapatalk

Hi Retread and Cmil, Above the Green Line seems more geared towards longer term traders, but they do give info for short term trades, and use Red and Green zones for entry exit.
They use Slow Stochastic quicker setting at 5,1.

Just now, I put that at bottom of my charts for comparison. My take is that if you enter in Red zone, you must watch to exit as they state when the 10 EMA (THEIR pink line) is crossed. I would like to exit before that and working to find indicator that works better for exit. As far as entering in the Red zone, I don't mind doing that only because it just got there and I had no choice (had no IFT to enter).

But, I would not enter now unless I thought there was more upside left. So therein lies the rub! I am reviewing and will look at TrendLines which I use a lot fir decisions as well as MA crossovers and Slow Sto, BB, and MACD. ...and their slopes. Right now looks like S fund has more to run (as long as that feared, but now disappearing H&S pattern seems broken ) when compared to C fund because it is now hitting Major Longer Term (blue) resistance that goes back to Feb/March 2020 (pandemic start).

Dwcpf.png

SPX now.png
 
Back
Top