coolhand's Account Talk

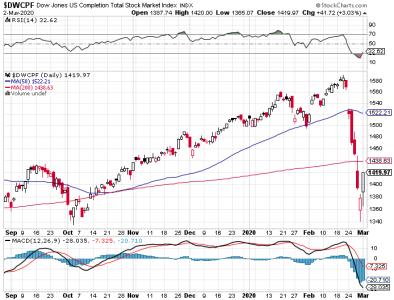
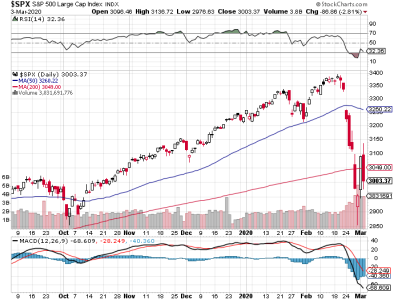
So, Monday's action was not a continuation of last week's accelerated sell-off.
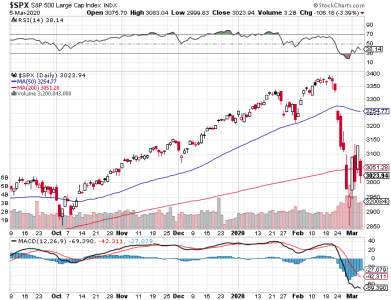
S&P 500.png
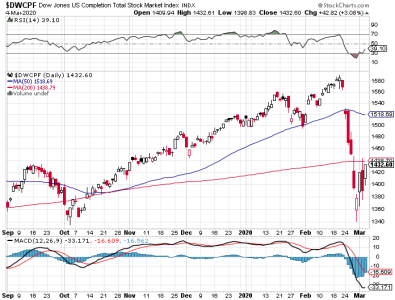
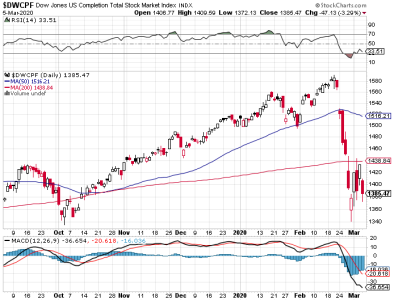
DWCPF.png

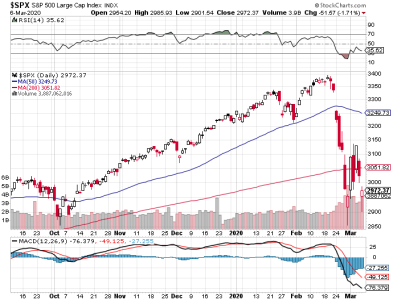
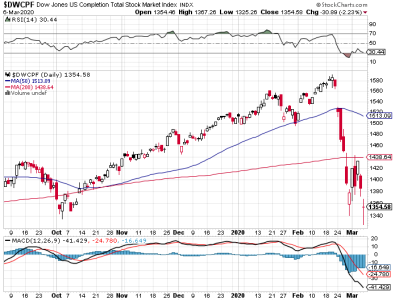
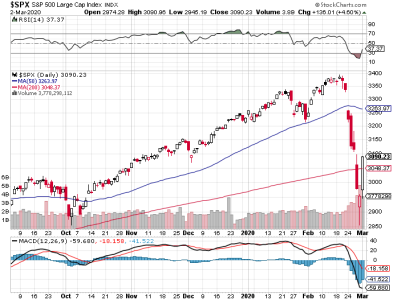
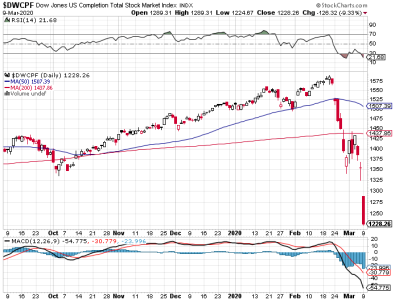
Looking at the charts, we can see we got a big bounce. Price is now well off the intraday low made Friday. Momentum may be turning and RSI exited an oversold condition. There is still plenty of upside resistance to cut through, however.

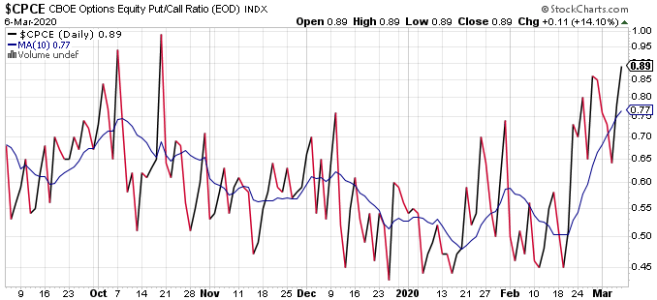
The CBOE is still leaning heavily bearish. TRIN and TRINQ are flat.
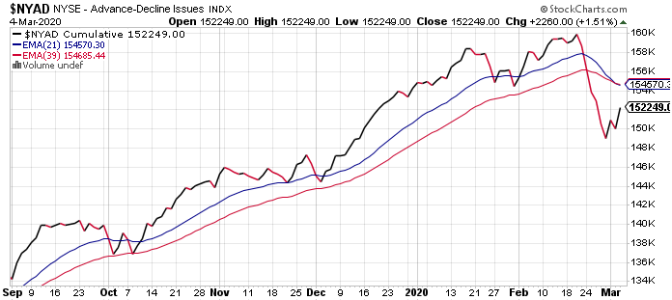
NYAD.png

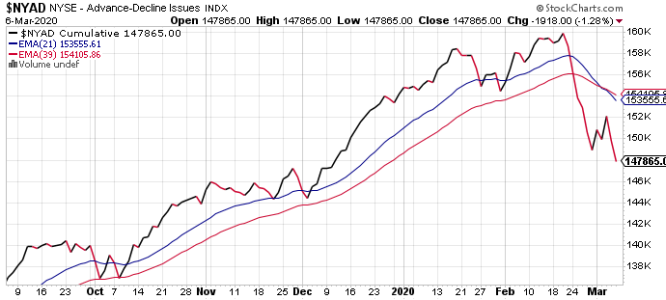
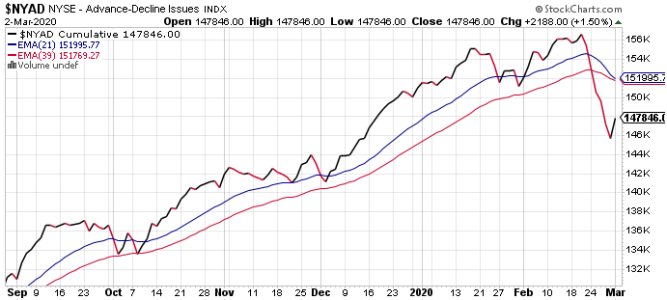
Breadth turned up, but remains negative.

Given volatility was at extreme levels, it is not a given that a bottom is in. I believe there is a good chance the lows get tested again. The only thing that gives me pause is the NAAIM reading, which still showed plenty of bulls.

I am remaining neutral.
 
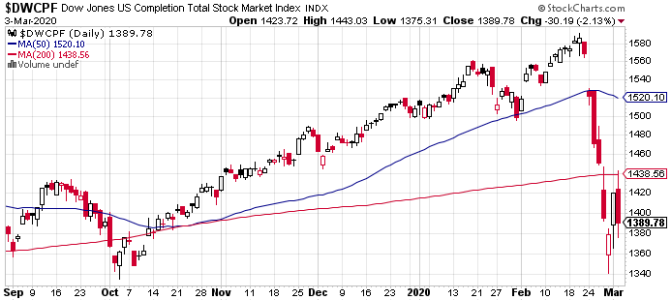
The market tried to tack on more gains in early trading today, but it wasn't long before the bears swamped the boat.

S&P 500.png
DWCPF.png

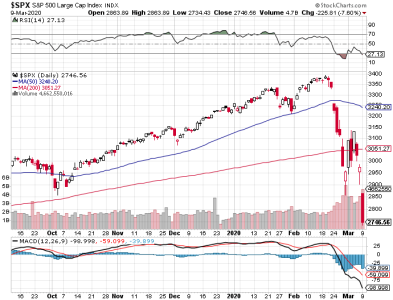
Perhaps the most notable thing about these charts is that the attempt to retake the 200 dma has failed twice. I do believe the lows will be tested. In fact, I think the market is likely to go even lower.

This evening, the CBOE has not reported. I don't know why this indicator is released later now. It used to be posted around 6 p.m. EST.

Breadth, which was already bearish, turned back down. TRIN and TRINQ are bearish for Wednesday.

The indicators suggest more selling for Wednesday. I am flipping from neutral back to bearish now that the market appears to be tipping its hand. While NAAIM did have a significant bullish aspect last week, some of these money managers are likely willing to take deep draw downs if they believe the selling pressure will not last and that the market will recover. We may also see a more bearish reading on Thursday if some of them are becoming less enamored with the bullish case. I will say that I myself still expect the market to recover within a few weeks or so. That's still my expectation though I do expect lower prices before the selling is reversed longer term.
 
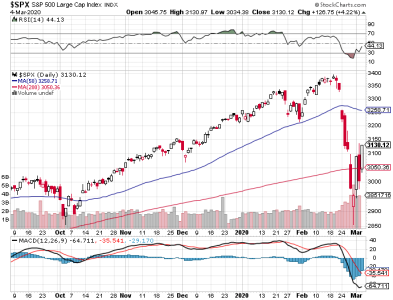
The market gave us another daily reversal, which is whipsawing traders on both sides of the trade given the size of the moves.

S&P 500.png
DWCPF.png

Price is back above the 200 dma on the S&P, but not the DWCPF. There is still resistance overhead.

This evening, TRIN and TRINQ are now neutral.

NYAD.png

Breadth has turned up again and is making some upside progress, but still remains bearish.

I still have no solid reason to shift from a bearish stance. NAAIM reports tomorrow.
 
The volatility continued today, as the market reversed once more and erased much of Wednesday's gains.

S&P 500.png
DWCPF.png

It seems we are tracking sideways in volatile fashion at the moment. Both charts show price under the 200 dma. The DWCPF is the weaker of the 2 charts, but not by a lot.

TRIN and TRINQ are leaning bullish this evening, so it seems we might see another reversal on Friday.

The CBOE has been bearish for about 2 weeks now. I suspect that won't change in the short term.

Breadth fell and remains bearish.

As I posted earlier today, NAAIM came in much more bearish. As bearish as I've seen them in a long time. I suggest earlier this week that this might be the case when we get the actual reading.

I remain bearish. I still think the market finds lower prices sooner or later. I know I said that I didn't think "they" would let things fall apart, but I got some intel today that says the game may have changed. I have no inside info on that, so don't take it for fact, but what I heard seemed very plausible to me that this might be the case. I have no timeline on it, but I suspect it may be weeks yet before this all plays out. The volatility may be buying certain players time (up/down) while chess pieces are moved around. Then the bottom may fall out. Again, I can't be sure of this, but I'd like you to know what I'm hearing and thinking.

The fact that NAAIM is now bearish should be respected to the extent you are comfortable (along with any other info you use to make decisions).
 
When you say NAAIM is bearish, do you mean a high bull reading (contrarian) or a high bear reading?

Sent from my SM-J320P using Tapatalk
 
NAAIM is smart money. It is not a contrarian sentiment indicator. They are bearish.
Thx, and FYI, I see it precisely the opposite. Namely, the aaii is an undeniable contrarian indicator, the dumbest $ out there. After all, it surveys people like me. I will be waiting for another reading b4 considering a move, however.
 
Thx, and FYI, I see it precisely the opposite. Namely, the aaii is an undeniable contrarian indicator, the dumbest $ out there. After all, it surveys people like me. I will be waiting for another reading b4 considering a move, however.

If I understand you, AAII is not the same as NAAIM, which stands for National Association of Active Investment Managers. One is dumb money and the other (NAAIM) is smart money.
 
If I understand you, AAII is not the same as NAAIM, which stands for National Association of Active Investment Managers. One is dumb money and the other (NAAIM) is smart money.
Thx, I see that now...and...I also see how NAAIM bearish sentiment drop similar to this week also preceeded the further collapse in late 2018.

Sent from my SM-J320P using Tapatalk
 
It was a wild week last week, and price on the S&P 500 and DWCPF closed mixed on the week. One was up and the other was down.

S&P 500.png
DWCPF.png

The S&P 500 closed with a moderate weekly gain (doesn't feel like it, does it?). However, the DWCPF got whacked and closed at a fresh low. Momentum points lower on both charts.Price is under the 200 dma on both charts as well.

CBOE.png

I don't show this chart much, but this is where I get my CBOE reading. The CBOE is considered dumb money, but they have been bearish for about 2 weeks now. Dumb? I have not been using this sentiment as a contrarian indicator for some time now. I treat it more like smart money, but it isn't as accurate as NAAIM, which is true smart money. NAAIM gave us a solid bearish reading last Thursday.

TRIN and TRINQ are neutral heading into Monday.

NYAD.png

Breadth headed even lower on Friday. This is not a healthy chart if you're a bull.

My perspective on sentiment has changed over the past 2 years or so. Because the CB has been losing control (or lost control), I believe many indicators are now suspect. I also believe that the current market carnage is not so much historic as it is biblical. Many of you will not understand what I am talking about (some of you will), but I am very confident that over time much will become more clear as things come into focus in the rear view mirror. My point here is that lower prices are likely, but I don't know how low or how long this goes on. The oil market is reeling. Bonds are in trouble. The banks are in trouble (QE, REPO, etc.). We have news of the virus (fear mongering) just about everywhere (constantly). I could go on, but you get the picture.

I am watching gold and silver carefully, because I don't think it will be long before they break free of manipulation. J.P. Morgan is under investigation for RICO charges (Jamie Dimon supposedly had emergency heart surgery in the past 2 days). Draw your own conclusions, but I don't think it's a coincidence. I am hearing that the days of price rigging may be coming to a close in the not-too-distant future.

It seems chaos is accelerating. If ever the phrase "it's different this time" applies, I think this may be it.

Sorry if I have no good news, I am just telling it as I see it (currently). I remain bearish.
 
It was a wild week last week, and price on the S&P 500 and DWCPF closed mixed on the week. One was up and the other was down.

View attachment 45609
View attachment 45608

The S&P 500 closed with a moderate weekly gain (doesn't feel like it, does it?). However, the DWCPF got whacked and closed at a fresh low. Momentum points lower on both charts.Price is under the 200 dma on both charts as well.

View attachment 45610

I don't show this chart much, but this is where I get my CBOE reading. The CBOE is considered dumb money, but they have been bearish for about 2 weeks now. Dumb? I have not been using this sentiment as a contrarian indicator for some time now. I treat it more like smart money, but it isn't as accurate as NAAIM, which is true smart money. NAAIM gave us a solid bearish reading last Thursday.

TRIN and TRINQ are neutral heading into Monday.

View attachment 45607

Breadth headed even lower on Friday. This is not a healthy chart if you're a bull.

My perspective on sentiment has changed over the past 2 years or so. Because the CB has been losing control (or lost control), I believe many indicators are now suspect. I also believe that the current market carnage is not so much historic as it is biblical. Many of you will not understand what I am talking about (some of you will), but I am very confident that over time much will become more clear as things come into focus in the rear view mirror. My point here is that lower prices are likely, but I don't know how low or how long this goes on. The oil market is reeling. Bonds are in trouble. The banks are in trouble (QE, REPO, etc.). We have news of the virus (fear mongering) just about everywhere (constantly). I could go on, but you get the picture.

I am watching gold and silver carefully, because I don't think it will be long before they break free of manipulation. J.P. Morgan is under investigation for RICO charges (Jamie Dimon supposedly had emergency heart surgery in the past 2 days). Draw your own conclusions, but I don't think it's a coincidence. I am hearing that the days of price rigging may be coming to a close in the not-too-distant future.

It seems chaos is accelerating. If ever the phrase "it's different this time" applies, I think this may be it.

Sorry if I have no good news, I am just telling it as I see it (currently). I remain bearish.
Loved the last lines, you sounded like the oracle . Of course she told him what he needed to hear.
Sent from my Pixel 2 XL using Tapatalk
 
By now, many are now realizing that buying the dip is not working. The CB has always lulled market participants (over a long period of time) to expect higher prices over time. It works and works and works for a long time and then...the plug gets pulled when we don't expect it. That's what they do. And it comes down a whole lot faster than it went it up. Great system, huh? Who benefits?

It ain't us. You have to be in the club and we ain't in it (George Carlin quip). Profanity laced George Carlin video...

https://www.youtube.com/watch?v=cKUaqFzZLxU

S&P 500.png
DWCPF.png

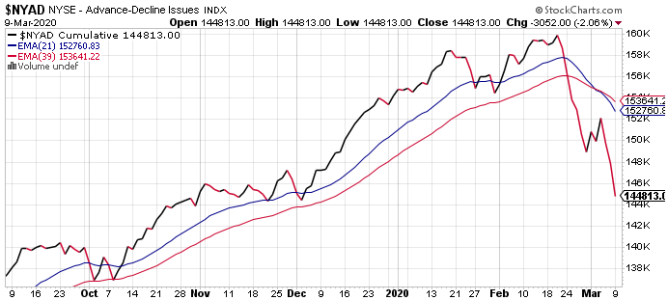
What can I say about these charts that isn't already obvious? The market has fallen off a cliff.

NYAD.png

Breadth is just as ugly.

I'm going to toss TRIN and TRINQ in my commentary for now because they are not helping at all.

But NAAIM is. And they're pretty bearish as of last week. The CBOE is heavily beared up again for tomorrow.

I don't think the carnage is over. It will stop eventually, but the market was really, really up there and now has a long way it can fall. I have no idea where the bottom might be either. 666 was the bottom for the S&P in last really big sell-off. And it was no accident it stopped at that number. I don't think we come anywhere near that number this time, but it won't be up to the CB like it has in the past. They have already lost control.

I remain bearish.
 
  • Like
Reactions: Rod
Back
Top