coolhand's Account Talk

Makes sense I guess...


Sent from my iPhone using Tapatalk

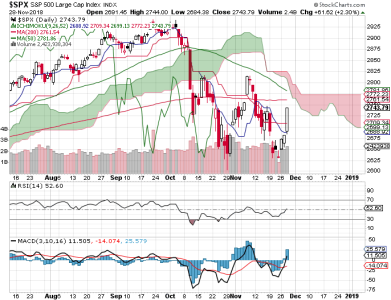
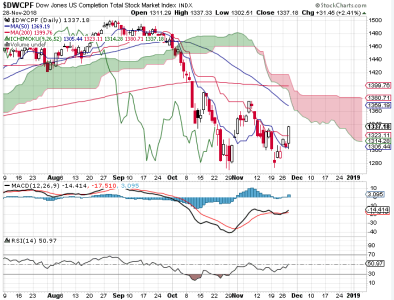
Every once in a while the Fed will say something that has a big impact on stocks. Today was one of those days. It is not a secret that when the Fed is raising rates, it often means a recession (or even a significant sell off) is coming. Some were warning the Fed that they were risking a major downside event by being hawkish. I suspect that someone woke the Fed Chair up to that fact. In any event, the bulls got a big boost today, but they still are not out of the woods. Having said that, this market could rally significantly from here (not saying it will). We'll just have to see how long today's ramp job lasts.
 
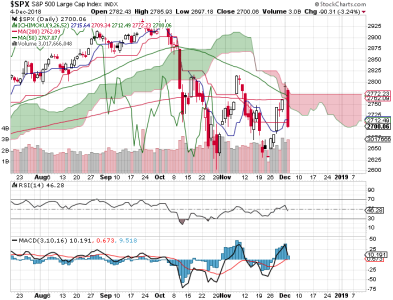
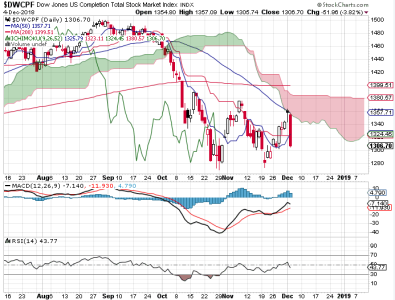
As I stated in my previous post, the Fed rallied the market today by toning down the hawkish tone.

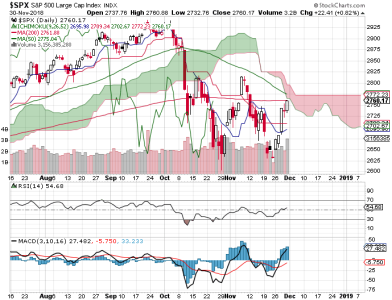
S&P 500.png
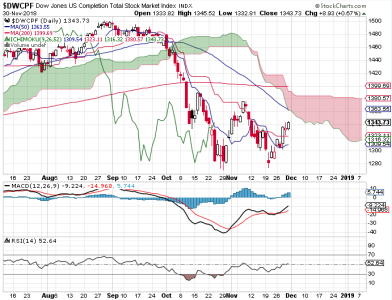
DWCPF.png

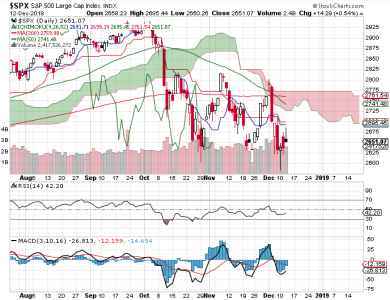
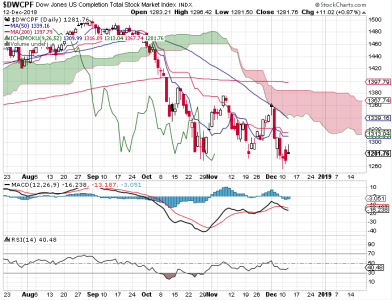
Today's rally looks like it may have legs given price closed near its highs of the day. But the S&P 500 is better shape than the DWCPF, which is not a longer term bullish sign. Price is still below key averages on both charts too. Momentum has turned up. The few days should be interesting.

Breadth is rising, which is bullish, but it's still technically negative (bearish). Another pop higher could flip it positive. The OEX is neutral now. The CBOE is bearish. TRIN and TRINQ remain bearish for the 3rd day in a row. My intermediate term system is improving, but remains negative.

Remember that NAAIM has been on the bearish side in recent weeks. They report again on Thursday. That will give us a better idea of risk. For now, I'm neutral, but acknowledge that today's rally may get extended.
 
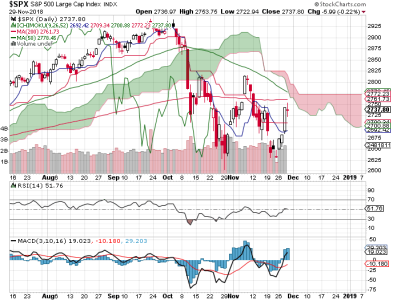
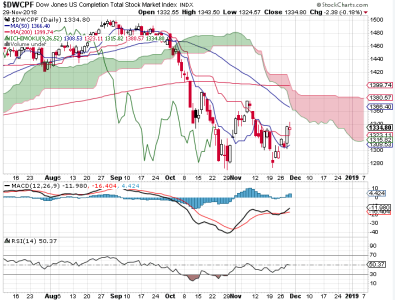
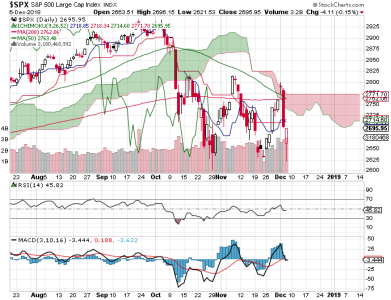
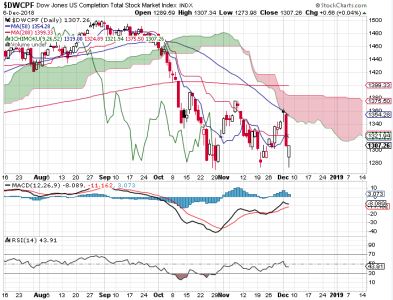
Despite some bearish readings in the indicators of late, selling pressure has not presented itself with the ferocity it did just a few trading days ago.

S&P 500.png
DWCPF.png

Be that as it may, today's end of day fade could be an indication that traders are not taking the Fed's more dovish tone all that seriously. NAAIM did come in more bullish, but here's the rub; they backed off on the shorting, but there is still plenty or risk aversion reflected in their long positions. In essence, they are neutral.

Breadth was only marginally lower today and remains negative. The OEX is neutral and the CBOE bearish. TRIN and TRINQ are now neutral.

My read is that any serious upside may be limited from here, but that may also be true of the downside. I am not seeing a compelling case for either bulls or bears in the short term. Longer term I remain bearish. I will say that this market may have some surprises for us over the next few weeks as we make our way toward and into the holidays. I am not sure what kind of surprises they may be (bullish or bearish), but since NAAIM is still cautious I'm thinking we should be too.
 
The bulls managed to make significant progress and recouping recent losses last week. The C fund was up almost 5%. And while the S fund's gains of 3.58% aren't anything to sneeze at, they are well below that of the S&P 500. I'm sorry if it seems like I'm looking for reasons to be bearish, but traders don't seem as comfortable buying smaller companies than their bigger cousins. That's an indication of risk aversion on some level. If I didn't point it out, I'd not be doing an honest assessment.

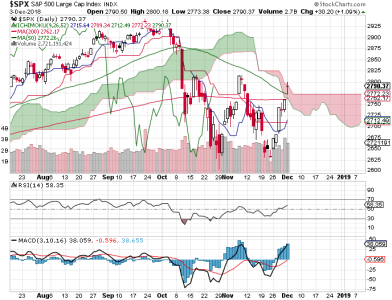
S&P 500.png
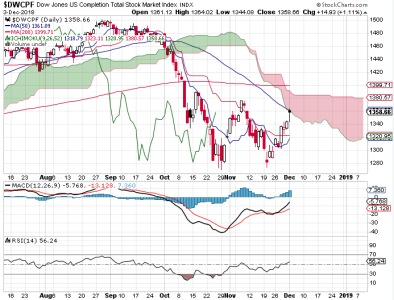
DWCPF.png

We can see that price on the S&P 500 closed at resistance (200 dma) on Friday. The 50 dma is just above that. Price on the DWCPF needs to go a bit further to get to its 50 dma and still well away from its 200 dma. Momentum is rising. Neither are overbought.

When I checked breadth, it was flat and neutral. This is not exactly bullish given the rally over the past week or so. Yes, it's risen to some extent, but it's not rising quickly as we've seen in the past. That means this is an uneven rally, which is also reflected in the disparity between the S&P 500 and the DWCPF. My intermediate term system flipped positive.

NAAIM is neutral and cautious. They have backed off on their shorting and increased their long positions, but not a lot. This is a yellow flag given the current market context. The OEX is modestly bullish for Monday, but the CBOE is solidly bearish. What is really revealing is that TSP Talk got real bulled up after last week's solid rally. That is not bullish heading into the new week. Both CBOE and TSP Talk are considered dumb money and they are both very bullish, which is bearish.

I'd like to be bearish for next week, and officially that's going to be my stance, but we are moving into a seasonally positive time of year so bulls are justified in being bullish under the circumstance (it really isn't till mid-month that seasonality gets more positive). However, this could be a trap given the bullish shift. I would not be surprised by some selling next week to back off newly minted bulls.
 
Well, I sure didn't see Monday's rally coming. Not that the market couldn't tack on some gains, but my indicators were flashing caution signs.

S&P 500.png
DWCPF.png

Today's action firmed up the bullish case. Price on the S&P 500 closed well above its 50 dma, but a higher high has not been made, though it isn't far off if the rally can extend. Price on the DWCPF closed at is falling 50 dma. It too has not yet made a higher high. The trend is up right now, so a higher high may be in the cards.

Breadth flipped positive today, decisively. I want to see that if I'm to entertain any notion of being bullish myself. The OEX is neutral, but the CBOE remains bearish (that didn't matter today). Momentum is rising.

The market is due a pullback, but seasonality may make it difficult for the bears to get much traction to the downside. Futures are a bit negative this evening, so we'll see what happens. If you aren't already aware, the market will be closed on Wednesday for a national day of mourning.
 
I knew there was a reason I wanted to be bearish and Tuesday's action remined me of it. Just as indicator were starting to flip positive, the bears ambushed and mauled the bulls for some heavy losses.

S&P 500.png
DWCPF.png

A large portion of recent gains were wiped out and we can see from the charts that price is well below key moving averages once more. Momentum has turned back down and breadth has flipped negative once more.

TRIN closed very high on Tuesday, which is bullish for Thursday. The options are neutral. NAAIM reports on Thursday.

I am shifting back to a bearish stance once more (longer term). Shorter term I think the market bounces on Thursday.
 
Well, it sure didn't take long to retest the lows. Thursday's action began where Tuesdays left off as price plummeted right at the open. But once price traded in the area of its previous low, the market firmed up and erased most of its losses or even tacked on gains depending on the index.

S&P 500.png
DWCPF.png

We can see that the market remains vulnerable, but the bounce suggests a move may be starting back toward the recent peaks.

Breadth remains negative. TRINQ is bearish for Friday (Nasdaq). The options have not reported this evening for some reason. NAAIM got a bit more bullish and is neutral.

My read is that this market may be trapped in a trading range for the time being. Someone did not want this market to hit fresh lows; at least not yet.

I am leaning bullish for Friday.
 
Is that a triple bottom on the DWCPF?

Both charts are showing triple bottoms, which normally is bullish. I would not make that assumption in this market, however. There is a battle going on between powerful forces for control of the market and so I recommend tempering expectations either way. NAAIM is spread out between bulls and bears and is neutral overall. They probably understand what's happening on a deeper level than most.
 
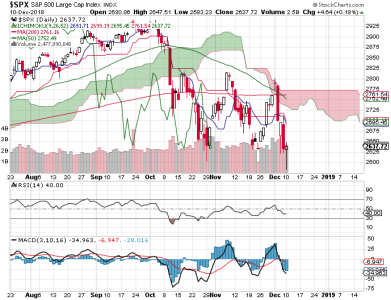
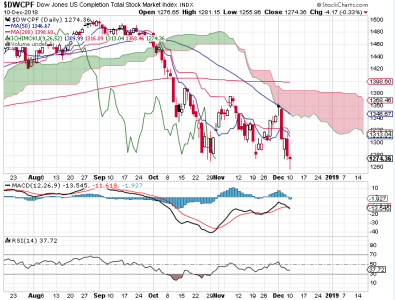
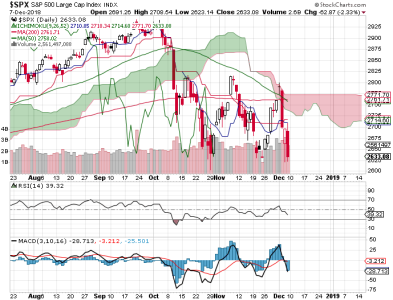
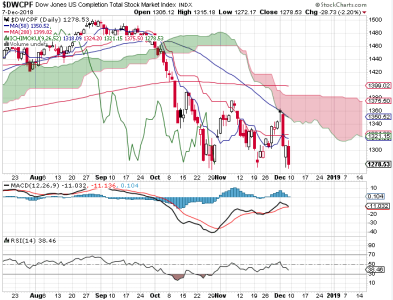
Price tested the previous lows again on Friday and closed at a fresh low, but not decisively. Still, it isn't look good for the bulls.
S&P 500.png
DWCPF.png

Both charts now sport negative crosses of the 50 dma through the 200 dma. Momentum has turned down. Breadth is negative. TRINQ closed very high on Friday, which is bullish (in a normal market). The OEX is neutral as is NAAIM. The CBOE is leaning to the bullish side. TSP Talk got bearish, so that's bullish from a contrarian standpoint.
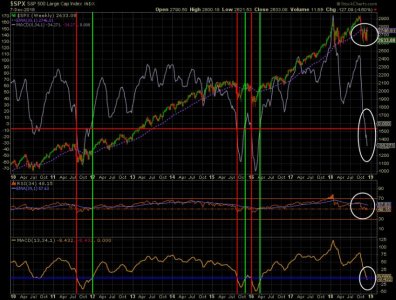
LT SPX.jpg

Every once in a while when the market is struggling, I trot this chart out. We can see the technical deterioration of the S&P 500 here. Working my way through the circled areas from top to bottom, note that price is showing volatility, but has not fallen apart (yet). MACD is now in a danger area. RSI is near its neutral line after dipping lower a few weeks ago. MACD on the bottom indicator is also in a danger area.

If you're bullish, this chart should concern you. That's not to say things can't turn, but you'd be ignoring some serious cracks in this market (remember, this bull is on the older side). All things considered, the PPT is probably working hard to keep price from plunging much lower and at a faster rate. That doesn't mean they can defy gravity forever, it just means they are trying to control the unwinding of the Fed's balance sheet in as controlled a manner as possible. The system is not designed to go up forever (you can bank on that).

I do not know how long price can stay in a relatively controlled orbit. We may be seeing a controlled sell-off over a longer period of time (unlike 2001 and 2008), but I am not sure. I've been saying most of the year that I am longer term bearish and that has not changed. For next week, we could bounce given the fresh low, but for how long? Buyers are disappearing of late, so any bounce may be followed by more selling. Will seasonality save the market? I don't consider seasonality to be much of a factor in the current market context, so I'd be inclined not to bet heavily on it. I think you can still take your shots at upside action when things are looking dire, but the highs are very likely in the rear view mirror. Rallies should be sold in my opinion.
 
The bears got the upper hand to start off the week, but the bulls (PPT?) turned it around to keep the indexes at least somewhat buoyant.

S&P 500.png
DWCPF.png

Long tailed candlestick on the S&P 500, which suggests a bottom (ordinarily). Similar situation on the DWCPF, but a new closing low was established.

Breadth hit a new low on Monday's action, so the turnaround did not improve that indicator. My intermediate term system is not far from flipping negative again.

The OEX is leaning bullish for Tuesday. The CBOE is neutral.

No change to the current technical picture (bearish). It's possible that a bottom may be in (for now), but futures are pointing lower as a write this so another wave of selling may be on the way. It's not an easy market to make money in for either side.
 
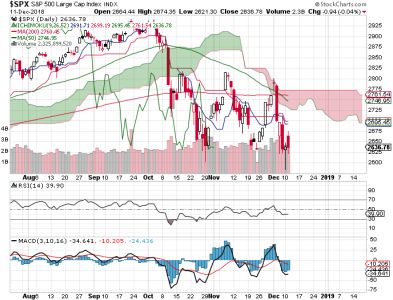
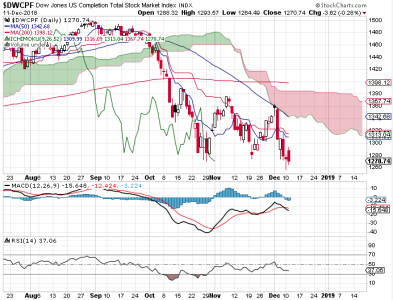
So, Monday we saw price spike lower early in the trading day, but rally back to near neutral by the close. Tuesday, we got the opposite. Up at the open and then down into a neutral close (relatively speaking).

S&P 500.png
DWCPF.png

The DWCPF closed at a lower low today. The S&P 500 ticked a bit higher. Price is in an area of support, but how supportive is it really?

Breadth ebbed lower today and remains negative. The OEX is bullish and the CBOE is neutral.

I don't have a strong conviction either way for Wednesday, but since the OEX bullish I'd be looking for a least some measure of buying on Wednesday; even if it doesn't hold.
 
While we certainly have taken some hits lately there are no hot indicators in either direction.
Fundamentally, everything looks fine. Sometimes its best to just hold your ground, in or out.
 
While we certainly have taken some hits lately there are no hot indicators in either direction.
Fundamentally, everything looks fine. Sometimes its best to just hold your ground, in or out.

Perhaps not in the short term, but the longer term trend is down. I've learned that it's best to trade longer term in the direction of the trend.
 
The OEX predicted higher prices today and we got that. But the sellers were still out there as price closed well of its highs.

S&P 500.png
DWCPF.png

We have bear flags forming again with what may be significant support not far below. Note the lower lows and low highs. That's the trend (down). It's just controlled at this point.

The options are neutral this evening. Breadth remains negative, though it did tick higher today. Momentum is trying to turn back up.

So, the dance continues. NAAIM reports tomorrow.
 
Back
Top