Chart Analysis

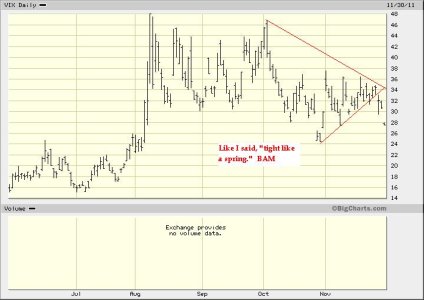
To me that VIX chart looks like it's finally relaxing to normal daily ranges (of the last year anyway), not so much "coiling".

Maybe you are saying that reduction in daily VIX swings may lead to a more stable price trend/direction? If so, I hope that direction is up!

post 218 " there is a real big move that is about to happen."
vix 11-30-11 mod.JPG
 
To me that VIX chart looks like it's finally relaxing to normal daily ranges (of the last year anyway), not so much "coiling".

Maybe you are saying that reduction in daily VIX swings may lead to a more stable price trend/direction? If so, I hope that direction is up!

Well we've made a bold move and the price direction is up, VIX is down! Here's to hoping the reduced volatility holds and a predominant (less volatile) trend up is in place. I know, for now, I plan to stay long.
 
Well we've made a bold move and the price direction is up, VIX is down! Here's to hoping the reduced volatility holds and a predominant (less volatile) trend up is in place. I know, for now, I plan to stay long.

For those who hit these recent moves just right, congrats. It would be wise to take some of your profits off the table. You get two more moves starting tomorrow for December.

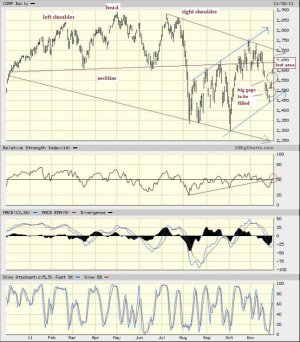
comp 11-30-11 mod.jpg
 
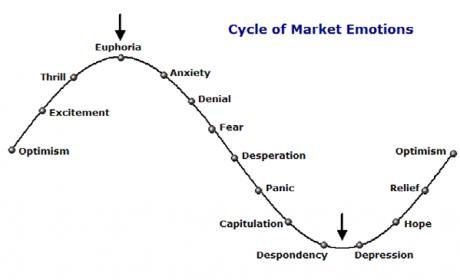
I don't know. We are barely half way back to where we were in October. I don't think 2 good, albeit big, days can bounce us from depression, skipping over hope, relief, optimism, excitement AND thrill ALL the way to euphoria.

I know I'm somewhere around the optimism point. With so many people on the board expecting a drop I feel good being long. Thinking this could be the set up for some people feeling left behind, chasing and propelling us higher.

Obviously that's just my impression of the current market psychology (emotion). Staying long is a risk but it's tough to get any reward without risk.
 
I'm with you Mapper. I'm optimistic about December and move 100% S Fund today, so I would have my 2 IFT in December if I'm wrong.
 
http://stockcharts.com/h-sc/ui?s=$SPX&p=D&yr=0&mn=6&dy=0&id=p36841493207

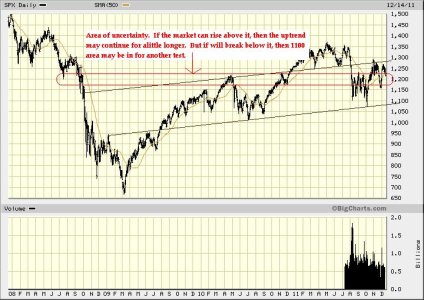
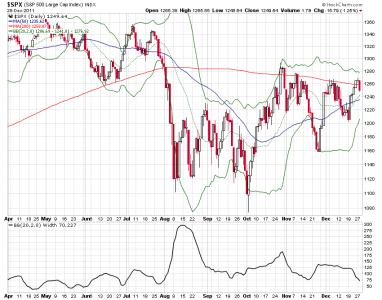
I want to point to a interesting convergence. Upper trend line violated and/or reset. The 200 sma violated but not confirmed. Upper bollinger band declining . That will make for a interesting convergence and massive resistance.

Merry Christmas!

Not to mention we are in a declining market and declining 200 dma. I had a coworker who timed the market very well, he was in the market when the 200dma was going up and out when it was going down. Point, caution is warranted.
 
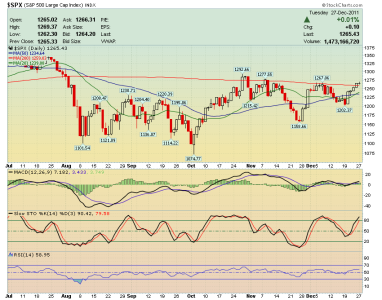
For me it would have to be a solid close above 1266 and I would like to see it at least a third day above the 200 day moving average.
 
I don't buy the last week of Dec. is the Santa rally. I looked back until 2004 and it can come in the second to the last week in December or the last week but rarely both weeks. It did happen both weeks in 2004 but that was like a dream back then. lol

sp1210.png

sp1209.png

sp1208.png

sp1207.png

sp1206.png
 
I don't buy the last week of Dec. is the Santa rally. I looked back until 2004 and it can come in the second to the last week in December or the last week but rarely both weeks. It did happen both weeks in 2004 but that was like a dream back then. lol
Ironically, sentimentrader.com's data on this goes from 1950 to 2004, but you're right. It seems we have been burned a lot in the last week in the last several years.

But using the 1950-2004 data, and using a series of seasonal indicators on a scale of 0 to 4 with 4 being the most positive seasonal strength, Dec 30 of this week, this year, is the only day in 2011, and in 2012, that got a 4.

Yeah, we're due for a little rest here, but these last few days are very much affected by money managers selling losers and padding their portfolios with winners. I think many of them missed the rally and will be looking to do more buying than selling in the next 2 days. That may not be enough to keep the indices positive, but that could provide a bid under any dips.
 
Repost:

Charts are looking weak, S&P tested upper resistance and the 200 sma and failed. It is back in its range and coming to a apex that has to break out. Which way? The Bollinger Bands are rapidly converging "the Squeeze" and that is a sign we are getting ready to break out.

The BandWidth indicator can be used to identify the Bollinger Band Squeeze. This alerts chartists to prepare for a move, but direction depends on the subsequent band break. A Squeeze and break above the upper band is bullish, while a Squeeze and break below the lower band is bearish. Be careful for head-fakes though. Sometimes the first break fails to hold as prices reverse the other way. Strong breaks hold and seldom look back. An upside breakout followed by an immediately pullback should serve as a warning.
http://stockcharts.com/school/doku.p...ger_band_width

sc.png
 
Nice bounce, but what does it prove?

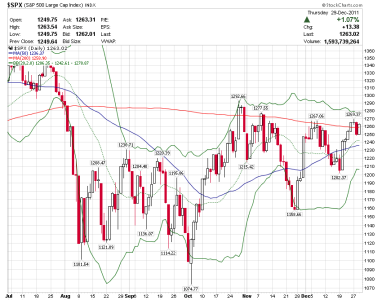
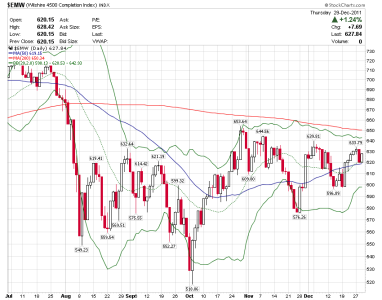
Pros: We are back above the 200 sma and testing the upper trend line.

Cons: We need follow through, no higher high, 200 sma is still in a decline and light holiday volume.

Other stuff: Oscar believes that holiday action will be reverse once the holiday is over.

S fund did hold support at the 20 and 50 sma.

sc.pngsmall.png
 
Back
Top