I find that overlaying price over time is very difficult, lots of folks think they can do it, but the majority of the time we are wrong. I'll estimate that we won't revisit the 2012 highs this year because that would imply a 10% climb over the next 6 weeks. If I were wrong and November were to close just under flat, then I could entertain a 6% December, that would take us to a 2012 high of 1486.66. At this point I'd estimate an horific January/Febuary with a >8% decline taking us back to 1370. That's the upside projection.
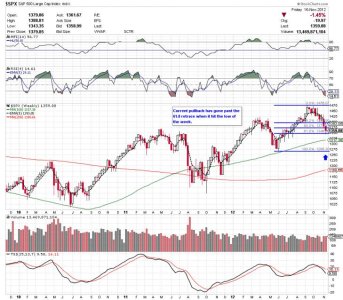
For the downside, I show the 1266 swing low from Jun 2012 to be the key pivot of which a breakdown below would lead to a test of 1175. If 1175 fails, that indicates a test of 1075 to 975. I realize these are bleak projections, the bottom line (and what we do know) is that momentum is wanning, what happens after that is anyone's guess.
 View attachment 21181


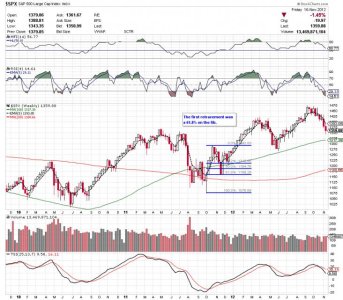
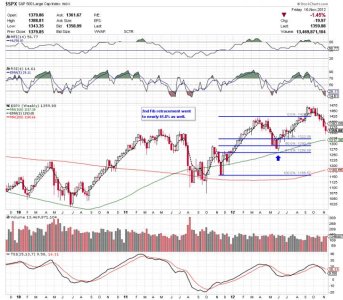
 The first and second fib retracements went all the way down to the 61.8% retrace. The current pullback has now touched the 61.8% retrace on the weekly chart. If that level holds, I see a large run possible. Pres. Obama and congress have both said they feel hopeful that they can avoid the fiscal cliff which is giving hope to the market. I am not a buyer at this level, but I might be towards the end of the week if it seems to be holding or moving back above its 5 EMA.