JTH
TSP Legend
- Reaction score
- 1,158
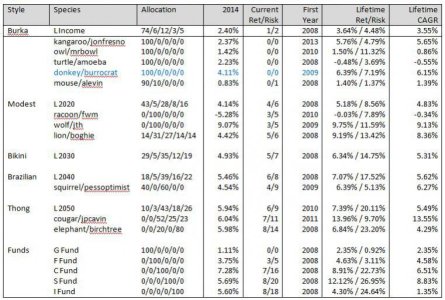
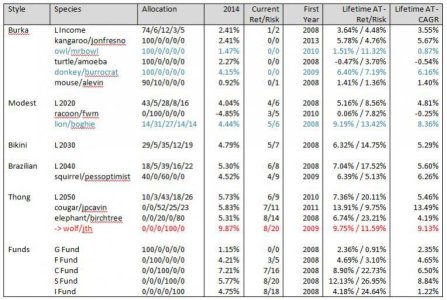
the green shaded cells are colored proportionately according to the value they contain on a scale of 1-10. are they a single cell and is there a formula for that? or is it 10 small cells without gridlines and manually shaded with the data entered into cell #5 and center justified? either way, it's totally cool.
if you were an artificial intelligence or female, or better yet a female artificial intelligence, your spreadsheets and charts would make me horny. actually, they do anyways, but don't tell anyone. it's not like i'm going to hunt you down over the internet and send you flowers or anything, it's not like that at all.
you look very nice in that spreadsheet today jth, it flatters your figures.
Thanks friend, I used the data wizard to paste your text into the individual cells, separating the data by a "," (Something Tom showed me)
The Green cells are proportionate to the cells highlighted, so the highest number gets the most green. In this case, each column was highlighted individually, then I used MS-EXCEL 2013's Conditional Formatting-Data Bars-Green Data bar. As you can see from the attached picture, I omitted FWM's YTD cell because it screwed with the visual flow. Lucky me, I finished with my school work early and was just finding a relaxing way to unwind for the evening, I figured I'd try to attach the excel sheet in case you liked it.
View attachment 29199


