-
The Forum works well on MOBILE devices without an app: Just go to: https://forum.tsptalk.com
-
Please read our AutoTracker policy on the IFT deadline and remaining active. Thanks!
-
$ - Premium Service Content (Info) | AutoTracker Monthly Winners | Is Gmail et al, Blocking Our emails?
Find us on: Facebook & X | Posting Copyrighted Material
-
Join the TSP Talk AutoTracker: How to Get Started | Login | Main AutoTracker Page
You are using an out of date browser. It may not display this or other websites correctly.
You should upgrade or use an alternative browser.
You should upgrade or use an alternative browser.
bmneveu's Account Talk
- Thread starter bmneveu
- Start date
JTH
TSP Legend
- Reaction score
- 1,158
I too was tempted to go in on the bull flag. But I'm worried about the middle-finger forming. If that turns into something else, I'll look to get back in.
Looks like a classic Middle Finger Formation, based on this data I'd expect an execution on or about 22 Jan. Estimated Upside PO 1870-1885, downside 1800-1820
View attachment 26782
If it makes you feel any better, the last time I posted a MMF, the markets put in a reversal just a day later, taking on a -5% decline
bmneveu
TSP Pro
- Reaction score
- 91
So far we've popped, dropped, and trickled back up a little. Id like to see it trickle up the rest of the day. I've seen this pattern many times before. It's a pop, drop and trickle kinda day!
Posted that back on April 24th. Same pattern today, minus the bit of weekend selling at the end of the day.
So far my IFTs have worked out well this month. I came into the month already in the S fund, avoided this 3 day dip and got back in for today's gains. I am a little worried about being exposed over the weekend with what's going on in Iraq. I honestly don't see more than maybe 1% left to the upside for this move. I'll try to post a chart sometime this weekend explaining my thought process there.
Hope everyone enjoys the weekend. I should probably go fill up my gas tanks. Or look in to trading in for an electric car.. I wonder why solar panels on cars hasn't hit mainstream yet. They probably don't make enough energy. Now I'm just rambling...
bmneveu
TSP Pro
- Reaction score
- 91
I honestly don't see more than maybe 1% left to the upside for this move. I'll try to post a chart sometime this weekend explaining my thought process there.
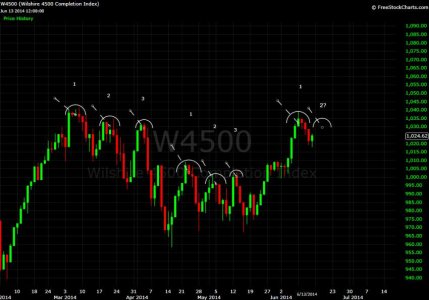
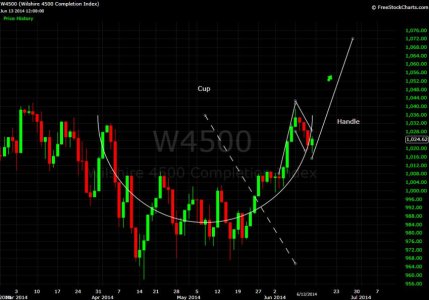
I just drew them now because I'd like to get some opinions. I have 2 charts. The first is what I saw originally with maybe 1% upside on the w4500 to 1035 or so. The second is a much more bullish Cup and Handle formation with upside in the 5%+ range. What do you all think?


Sensei
TSP Pro
- Reaction score
- 27
Have you seen this? LOL.Hope everyone enjoys the weekend. I should probably go fill up my gas tanks. Or look in to trading in for an electric car.. I wonder why solar panels on cars hasn't hit mainstream yet. They probably don't make enough energy. Now I'm just rambling...
Solar FREAKIN' Roadways! - YouTube
(Just posting it for entertainment value - not to start an asterisk * discussion)
BTW, I like the charts. I have been mostly looking at them with a bearish perspective (Middle-finger or H&S type formation), but you make a good case with the bull flag/cup & handle. Judging by sentiment right now, I'd say it's a toss up. How's that for prognostication?
Bquat
TSP Talk Royalty
- Reaction score
- 717
Wow, I like the cup and handle pattern. Normally I see that kind of stuff but didn't look at W4500. I am trying to figure if my white channel in the S&P chart is a bull flag again. So if it is come on for your cup and handle. I am worried about the intraday double top today.
bmneveu
TSP Pro
- Reaction score
- 91
As of today I'm #1 on the Autotracker for the month of June with 3.21%, and #12 overall on the year for Non-Premium with 8.85%. Knocking on JTH and Sensei's doors! I only have a .4% lead over a pretty big pack so there is very little room for error. If the S fund is down tomorrow, I could drop like a rock down the rankings. I'll keep hoping my Cup and Handle on the w4500 chart plays out!
This is not the first time I've been #1 in a month. I think about 2 years ago I had a great first half of a month, pulled into the garage, and slowly watched others climb above me and knock me out of the top 5 on the very last day of the month. Still no coffee cup prize to this day. Right now I'm sipping out of a "Bark Less, Wag More" puppy-paw-printed mug. I wish my dogs could read.
I am 2 weeks away from my Associate's Degree, and it requires attention this morning. But later today I'll be watching the U.S. in the World Cup, and hopefully San Antonio win the NBA finals!
bmneveu
TSP Pro
- Reaction score
- 91
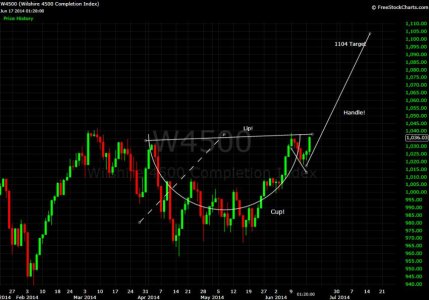
The Cup n Handle is continuing to play out on the S fund chart. Here's a new snapshot of it. The depth of the cup is the upside, starting from the lip. That gives us a 1104 target, about 70 points higher from where we are today. The most common recommendation I've found is to get in at the first close above the lip.


jkenjohnson
Market Veteran
- Reaction score
- 24
The Cup n Handle is continuing to play out on the S fund chart. Here's a new snapshot of it. The depth of the cup is the upside, starting from the lip. That gives us a 1104 target, about 70 points higher from where we are today. The most common recommendation I've found is to get in at the first close above the lip.
View attachment 29140
I hope it plays out
bmneveu
TSP Pro
- Reaction score
- 91
Interesting info on the S fund - Thanks! By the way #38 on the overall autotracker - good job and congrats!!!
Ohh a peak into the premium side! Thank you
JTH
TSP Legend
- Reaction score
- 1,158
bmneveu
TSP Pro
- Reaction score
- 91
how soon are you thinking about exiting your long tsp position?
if it takes off out of the gate and looks like it's headed for +1% at the close, then i'm thinking about twisting off tomorrow.
I'll probably take the house's money at that point as well. We've had a fantastic month. I don't want to get greedy and ruin it. That being said, I think I would be more comfortable staying in if it trickled up .3% or so every day. Maybe it's psychological, but probably better for overbought indicators.
bmneveu
TSP Pro
- Reaction score
- 91
ok just tell it to me straight, does that teacup graph thing suggest a rocket ride or a crash?
The Cup n Handle chart pattern is bullish after price breaks through the lip, which the w4500 (S fund) has just done yesterday and today. JTH's article shows the same pattern on the NASDAQ, which is bullish for tech stocks as well. If it played out, we would ride up the handle like a rocket.
bmneveu
TSP Pro
- Reaction score
- 91
North Dakota wouldn't be a bad idea if I was 18 without a purpose or direction.
Boom helps fast-food workers bring home the Bakken
Boom helps fast-food workers bring home the Bakken
bmneveu
TSP Pro
- Reaction score
- 91
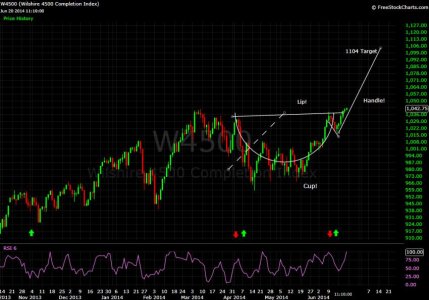
Trickling up the handle and I'm A-Okay with that. I added a few things to the chart. The green and red arrows show where I've IFT'd in and out. Green Up means I got in, Red Down means I got out. Now everyone can see where I've gotten lucky, and what I could have done better. I added a 6-Day RSI to the bottom. I chose that time frame for it because it was the lowest I could get it without it flatlining on 100 or 0. Coincidentally, today we hit 100. That tells us it is probably time to see some selling pressure.


Similar threads
- Replies
- 0
- Views
- 98
- Replies
- 0
- Views
- 107
- Replies
- 0
- Views
- 181
- Replies
- 0
- Views
- 92
