-
The Forum works well on MOBILE devices without an app: Just go to: https://forum.tsptalk.com
-
Please read our AutoTracker policy on the IFT deadline and remaining active. Thanks!
-
$ - Premium Service Content (Info) | AutoTracker Monthly Winners | Is Gmail et al, Blocking Our emails?
Find us on: Facebook & X | Posting Copyrighted Material
-
Join the TSP Talk AutoTracker: How to Get Started | Login | Main AutoTracker Page
You are using an out of date browser. It may not display this or other websites correctly.
You should upgrade or use an alternative browser.
You should upgrade or use an alternative browser.
Bear Cave 2 (Bull Allowed)
- Thread starter robo
- Start date
robo
TSP Legend
- Reaction score
- 471
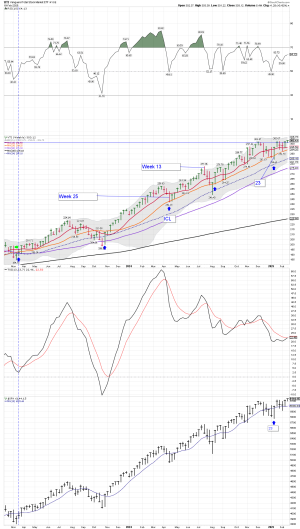
VTI weekly/monthly, and a few others: Is this a topping pattern or just a pause before the next run higher? I'm waiting to see if the tariffs are put into play, before I get back into stocks.
Attachments
robo
TSP Legend
- Reaction score
- 471
Still not much fear of BTD.

 thefelderreport.com
'A Sudden Shift In The Investment Landscape'
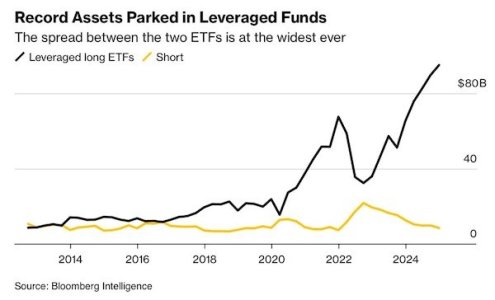
Below are some of the most interesting things I came across this week. Click here to subscribe to our free weekly newsletter and get this post delivered to your inbox each Saturday morning. STAT The appetite for leverage in the stock market currently appears insatiable. "Retail daredevils — undete
thefelderreport.com
Attachments
robo
TSP Legend
- Reaction score
- 471
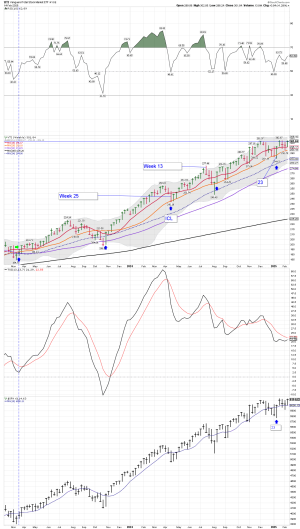
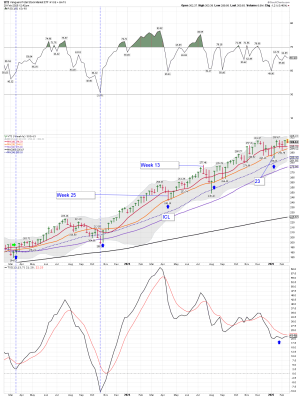
VTI weekly: It all looks good as VTI makes a new all time high..... For now BTD remains the play...
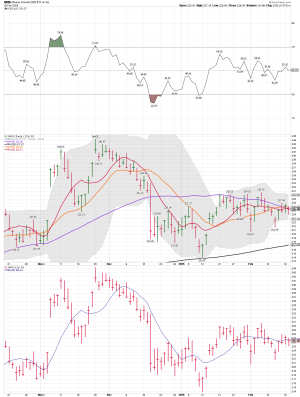
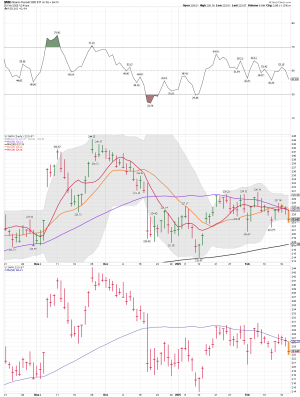
IWM daily: IWM is not leading the charge....
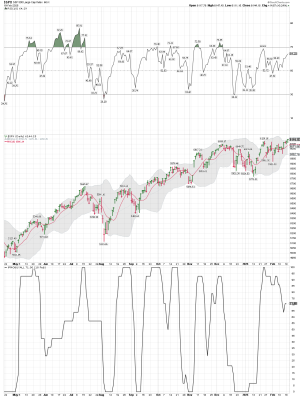
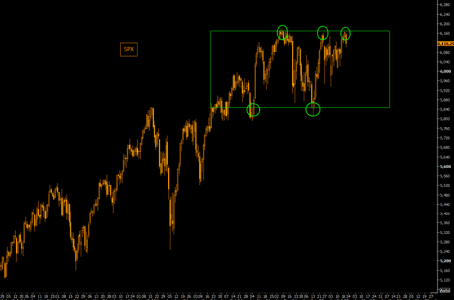
SPX daily: The move higher continues...
S Fund: Not leading....and having some trouble making a new all time high.... We shall see how the current compression plays out.
IWM daily: IWM is not leading the charge....
SPX daily: The move higher continues...
S Fund: Not leading....and having some trouble making a new all time high.... We shall see how the current compression plays out.
Attachments


robo
TSP Legend
- Reaction score
- 471
IWM daily: It continues to struggle and it should be leading..... Maybe it is!
Watching on the sidelines as I wait for the next tariff comments from Trump.
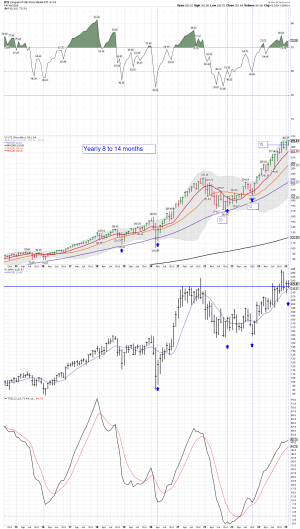
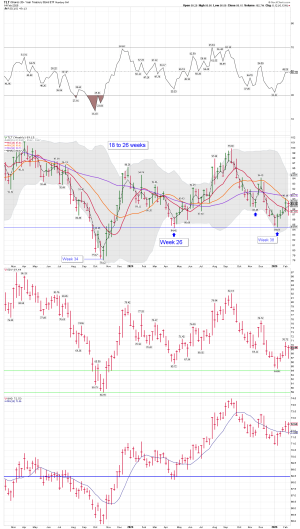
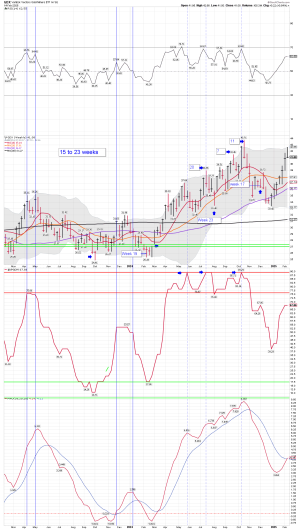
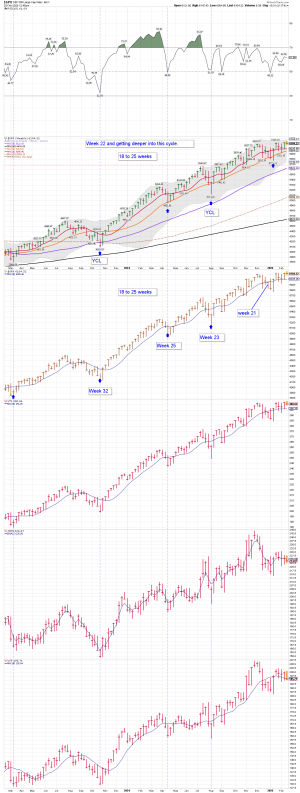
VTI weekly: A possible topping pattern remains in play or maybe getting ready for the next move higher. I'm staying very nimble as we move into March....
Watching on the sidelines as I wait for the next tariff comments from Trump.
VTI weekly: A possible topping pattern remains in play or maybe getting ready for the next move higher. I'm staying very nimble as we move into March....
Attachments
robo
TSP Legend
- Reaction score
- 471
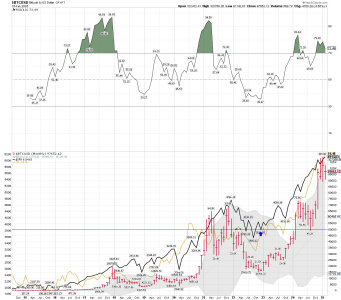
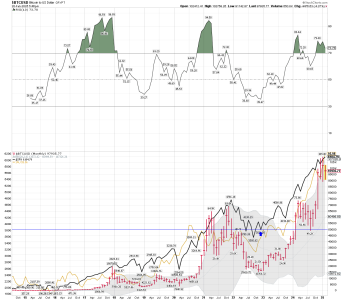
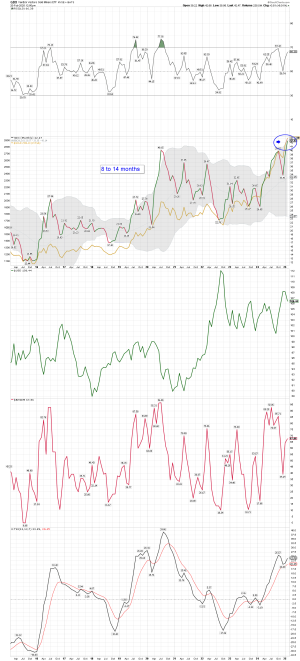
Coin and gold: GDX and gold topping at the same time is not a normal pattern. We shall see how it plays out. GDX is not leading, but the trend remains up!
We shall see what coin is trying to tell us....
We shall see what coin is trying to tell us....
Attachments
robo
TSP Legend
- Reaction score
- 471
Anytime the miners are NOT leading that is cause for concern.I'm guessing the lower RSI at the higher peaks is not a good thing in both gold (IAU) and bitcoin?
robo
TSP Legend
- Reaction score
- 471
We shall see how it plays out.... Others are watching this too.....
 themarketear.com
[td]Is this a failing break-out?[/td]
The Market Ear | Live news, analysis and commentary on what moves markets and trading | The Market Ear
The Market Ear | Live news, analysis and commentary on what moves markets and trading
themarketear.com
Yesterday it looked like SPX was getting ready for the break out to the upside. Today it looks like we might fail. Postponed break-outs normally lead to a little set-back. And this happens just as we enter into one of the weakest 2-week periods of the year. We data-mined and cherry-picked everything bearish across the Goldman Sachs research & trading desks. Click here to read them all. |
Attachments
robo
TSP Legend
- Reaction score
- 471
We shall see how it plays out. I currently have NO position in this sector.

12 What-Ifs for Gold Price to Challenge Your Bullish Perspective | Golden Meadow®
Can gold only go up? Can only bullish things happen for it? What if?... Two days ago (I encourage you to read it if you haven’t done so), I compared the current extreme fundamental forecasts for gold and expectations for the gold market to what we saw...
Gold Price 2025 Is The New 2011 | GoldPriceForecast.com
<p>Is gold truly on the verge of an explosive rally, or is the hype just another market illusion?</p>
12 What-Ifs for Gold Price to Challenge Your Bullish Perspective

Przemysław K. Radomski, CFA
AdminExpert
7h
Founder, CEO
Share
Can gold only go up? Can only bullish things happen for it? What if?...
robo
TSP Legend
- Reaction score
- 471
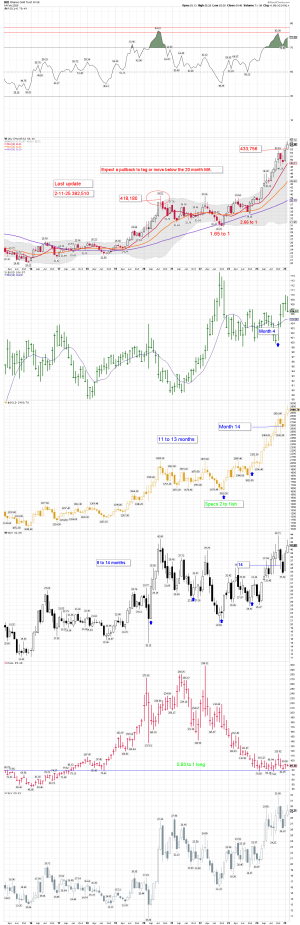
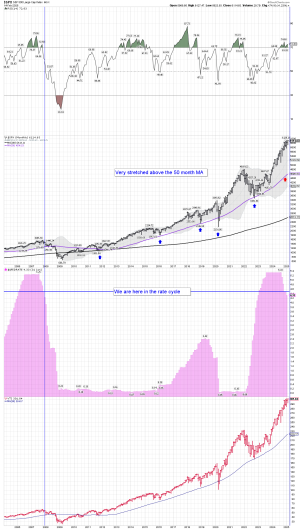
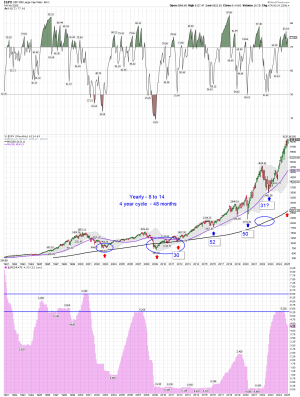
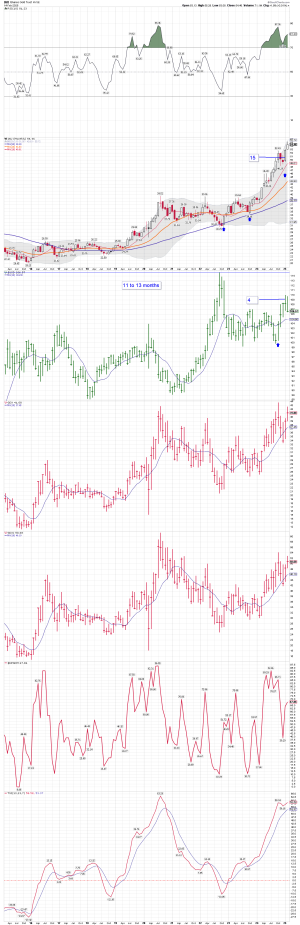
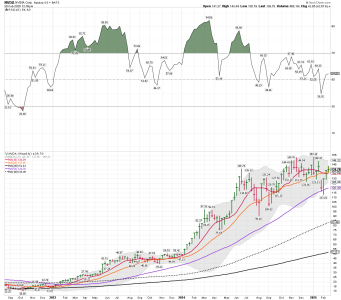
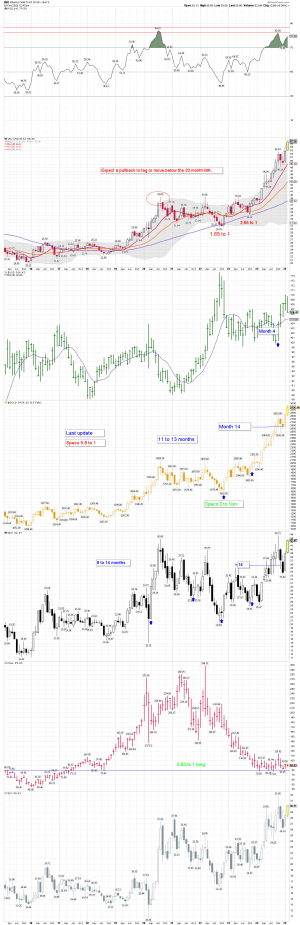
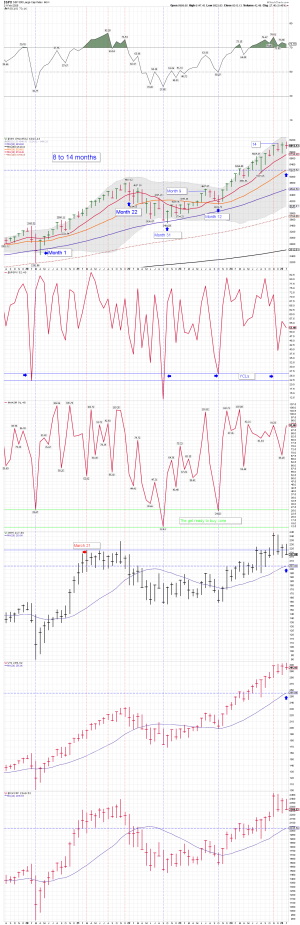
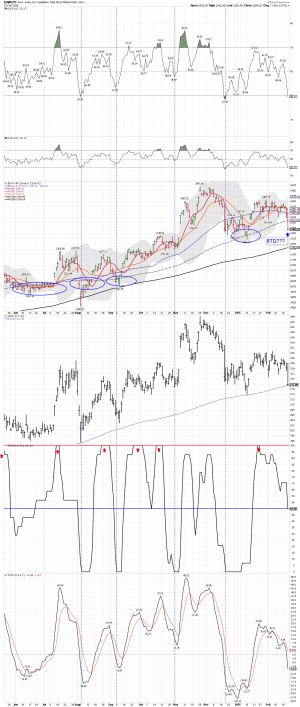
Cycles and the YCL: This is month 16 of this run and it has been a good one. Just BTD during any weakness and you made money.
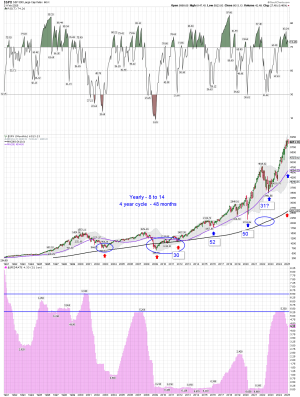
Monthly data: The YCL remains in play. A normal move into a YCL would be a tag or undercut of the 20 month MA. It's possible to see a tag of the 50 month MA. We shall see how this plays out. If we are headed into a 4 year cycle low, then a move down would be lower.... For now we haven't even tagged the 10 month MA so the trend remains up!
Monthly data: The YCL remains in play. A normal move into a YCL would be a tag or undercut of the 20 month MA. It's possible to see a tag of the 50 month MA. We shall see how this plays out. If we are headed into a 4 year cycle low, then a move down would be lower.... For now we haven't even tagged the 10 month MA so the trend remains up!
Attachments
Last edited:
robo
TSP Legend
- Reaction score
- 471
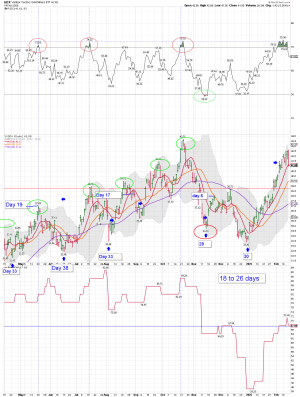
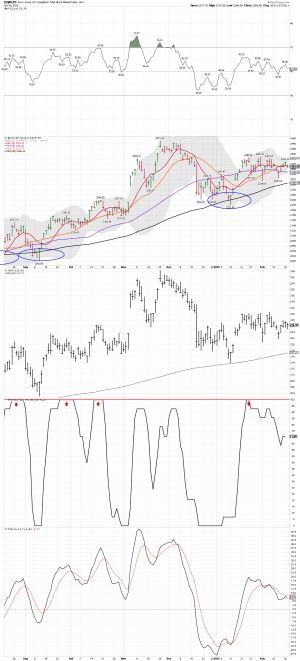
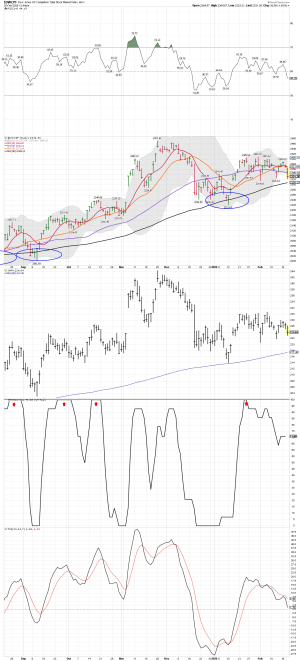
S Fund daily: I don't make trades based on cycle data only. I use the cycle data to try a catch and track the ICLs. "IF" we get a bloodbath phase it would really scare traders out of the market in the ST, and a move down to tag the 200 day MA would probably be in play.

 likesmoneycycletrading.blog
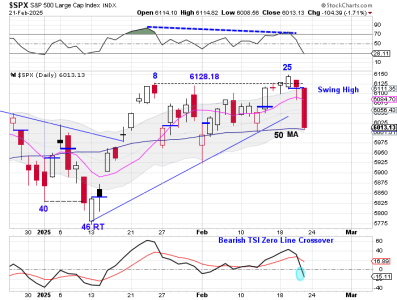
Friday was day 27, placing stocks in their timing band for a DCL. Stocks closed below the 10 day MA on Friday and managed to turn it lower. However, stocks also found support at the 50 day MA on Friday.
Stocks have satisfied the criteria for a DCL.
Stocks Deliver Bearish Follow Through
Stocks formed a swing high on Thursday then delivered bearish follow through on Friday. Friday was day 27, placing stocks in their timing band for a DCL. Stocks closed below the 10 day MA on Friday…
likesmoneycycletrading.blog
Friday was day 27, placing stocks in their timing band for a DCL. Stocks closed below the 10 day MA on Friday and managed to turn it lower. However, stocks also found support at the 50 day MA on Friday.
Stocks have satisfied the criteria for a DCL.
- Timing band (early)
- Stocks closed below the 10 day MA, turning it lower.
- Trend line break
- 38 % Fib retracement
Attachments
Last edited:
robo
TSP Legend
- Reaction score
- 471

Revenue Thoughts
John Mauldin asks if tariffs are really the best way to balance the budget.
 www.mauldineconomics.com
Last week we began discussing the import tariffs President Trump has been threatening. Most (China is the exception) have not taken effect yet. It’s possible they will never happen or will be quickly modified or rescinded as happened in Trump’s first term.
Real or not, the fact these tariffs might happen affects business and consumer confidence, which in turn affects the economy in broader ways. I showed last week how uncertainty surrounding growth and inflation was already high. Adding possible tariffs to the outlook is a further complication—and, in my view, an unnecessary one.
BUT… my view, like yours, is restricted. None of us outside Trump’s inner circle know what the real goals are. What looks like needless chaos might lead to benefits that outweigh the costs.
One potential benefit is revenue. Could the tariffs produce significant tax revenue that would help reduce the federal debt? The president seems to think so. He’s said it many times, often referring to the McKinley era when tariffs represented almost all the government’s tax revenue.
In the current situation, we obviously need all the revenue we can get. But every kind of tax has side effects. The goal should be to create a fair system that produces the necessary revenue at the lowest possible cost for the economy.
robo
TSP Legend
- Reaction score
- 471

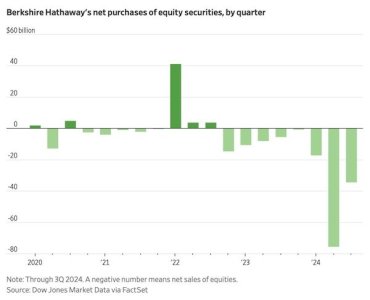
Another Massive Misallocation Of Capital?
Below are some of the most interesting things I came across this week. Click here to subscribe to our free weekly newsletter and get this post delivered to your inbox each Saturday morning. LINK "Half a trillion dollars have been invested in a misguided premise... Given the double whammy of price
thefelderreport.com
STAT
In stark contrast to this consensus, “Berkshire was a net seller of equity securities in the past eight reported quarters, and a regulatory disclosure of its U.S. stock positions in December suggests the selling extended to a ninth period,” reports the Wall Street Journal. As a result, Warren Buffett’s company has raised its cash holdings to the highest level as a percent of assets on record.
Attachments
Last edited:
robo
TSP Legend
- Reaction score
- 471