- Reaction score
- 2,928
-
The Forum works well on MOBILE devices without an app: Just go to: https://forum.tsptalk.com
-
Please read our AutoTracker policy on the IFT deadline and remaining active. Thanks!
-
$ - Premium Service Content (Info) | AutoTracker Monthly Winners | Is Gmail et al, Blocking Our emails?
Find us on: Facebook & X | Posting Copyrighted Material
-
Join the TSP Talk AutoTracker: How to Get Started | Login | Main AutoTracker Page
You are using an out of date browser. It may not display this or other websites correctly.
You should upgrade or use an alternative browser.
You should upgrade or use an alternative browser.
Bear Cave 2 (Bull Allowed)
- Thread starter robo
- Start date
robo
TSP Legend
- Reaction score
- 471
March 21, 2016
Extinction Burst
John P. Hussman, Ph.D.
From a near-term standpoint, given a well-defined top formation extending back to 2014, and a strenuously overbought advance that has now carried the market to the arc of that formation, my sense is that the preceding paragraphs would be most satisfying if I were to say that all evidence supports expectations of an immediate collapse, and that crash risk is our most pressing concern (as it was just a few weeks ago). Frankly, that outcome would still serve us best.
But like last week, our near-term outlook actually remains fairly neutral.
That near-term outlook would shift to a hard-negative view at about the 1975 level on the S&P 500, which is where the full weight of market action would pile to the downside again. I also continue to view the 1820 level as a potential crash threshold.
Hussman Funds - Weekly Market Comment: Extinction Burst - March 21, 2016
Stocks
Equity Rallies Hiding True Market Situation | Talk Digital Network
$NYA - SharpCharts Workbench - StockCharts.com
VXF - SharpCharts Workbench - StockCharts.com
$SPX - SharpCharts Workbench - StockCharts.com
http://stockcharts.com/h-sc/ui?s=SDS&p=D&b=5&g=0&id=p57046986545&a=443233825
http://stockcharts.com/h-sc/ui?s=IBB&p=60&yr=0&mn=1&dy=19&id=p90718962011&a=451117484
http://stockcharts.com/h-sc/ui?s=$SPXA50R&p=D&yr=4&mn=0&dy=0&id=p61473432329&a=449532649
http://stockcharts.com/h-sc/ui?s=$NAMO&p=D&yr=3&mn=0&dy=0&id=p51726606145&a=451466984
http://stockcharts.com/h-sc/ui?s=$VIX:$VXV&p=W&yr=5&mn=6&dy=0&id=p88948616174&a=449532684
http://stockcharts.com/h-sc/ui?s=UWTI&p=120&yr=0&mn=2&dy=0&id=p16385577114&a=444286233
Metals/Miners
http://stockcharts.com/h-sc/ui?s=GDX&p=D&yr=0&mn=6&dy=0&id=p06190594158&a=445995792
http://stockcharts.com/h-sc/ui?s=$GOLD&p=W&yr=1&mn=5&dy=0&id=p56080990358&a=449116881
http://stockcharts.com/h-sc/ui?s=GLD&p=W&yr=5&mn=0&dy=0&id=p34573305726&a=444286946
http://stockcharts.com/h-sc/ui?s=$BPGDM&p=W&yr=5&mn=0&dy=0&id=p74293775733&a=449310106
What to Watch For in Gold and Gold Stocks
By: Jordan Roy-Byrne | Fri, Mar 25, 2016
http://www.safehaven.com/article/40904/what-to-watch-for-in-gold-and-gold-stocks
https://www.goldbroker.com/news/the-gold-market-short-squeeze-mode-929
http://www.clivemaund.com/article.php?art_id=68
A small excerpt from Kaplan’s latest update.
This is update #2154 for Thursday late afternoon, March 24, 2016.
As has been the case in recent months, most emerging-market and energy shares have moved lower along with general global equities and usually by greater percentages. Eventually, these should be able to diverge positively during general equity pullbacks, but for now energy and emerging-market securities will outperform primarily by gaining much more on days when general equities are higher rather than by nearly always moving upward. Gold and silver mining shares continue to be more independent and to serve in their reliable role as leading indicators, by completing intermediate- and even short-term highs and lows before most other assets. As an example, after having completed an all-time bottom of 16.87 on January 20, 2016 along with many other assets, GDXJ has choppily rebounded with recent higher lows of 21.14 on February 10, 25.40 on March 15, and could be in the process of forming another higher low during the early spring. It does look incredibly tempting for gold to break below 1200 and/or for silver to fall below 15 to knock out recent excited long-side momentum players, so that may occur and if it does so will likely happen during the next few weeks (or days). Like a lion, you have to select your targets and be prepared to strike when the time is ideal and just about everyone else is going the other way.
For future reference, it is worth noting that GDXJ and similar funds, when they achieve higher highs, do so only fleetingly, and then return several weeks later to set new higher highs. This pattern is likely to continue and to become even more exaggerated in the early months of 2017 when these funds will be widely advertised as “the hottest stocks of last year.” Thus, when it becomes time to sell, it will be a good idea to do so gradually whenever they are enjoying upward spikes and most investors are eagerly buying them into strength. With most volatile assets, it is necessary to be simultaneously gradual and aggressive in accumulating and discarding them, because their lowest and highest levels will be visited only briefly and will soon be followed by significant moves in the opposite direction.
http://truecontrarian-sjk.blogspot.com/
I'm flat!
SevenSentinels @SevenSentinels Mar 24
12:10 Markets Stable Ahead of Holiday - "The Lull Before the Storm"
https://twitter.com/sevensentinels
Atilla Demiray @xtrends Mar 23
The four most dangerous words... http://www.xtrenders.com/2016/03/the-four-most-dangerous-words.html … via @xtrends
https://twitter.com/xtrends
robo
TSP Legend
- Reaction score
- 471
March 28, 2016
Run-Of-The-Mill Outcomes vs. Worst-Case Scenarios
John P. Hussman, Ph.D.
With the S&P 500 Index at the same level it set in early-November 2014, and the broad NYSE Composite Index unchanged since October 2013, the stock market continues to trace out a massive arc that is likely to be recognized, in hindsight, as the top formation of the third financial bubble in 16 years. The chart below shows monthly bars for the S&P 500 since 1995. It's difficult to imagine that the current situation will end well, but it's quite easy to lose a full-cycle perspective when so much focus is placed on day-to-day fluctuations. The repeated speculative episodes since 2000 have taken historically-reliable valuation measures to extremes seen previously only at the 1929 peak and to a lesser extent, the 1937 peak (which was also followed by a market loss of 50%). Throughout history, at each valuation extreme - certainly in 2000, 2007 and today - investors have openly embraced rich valuations in the belief that they represent some new, modern and acceptable “norm”, failing to recognize the virtually one-to-one correspondence between elevated valuations and depressed subsequent investment outcomes.
Wall Street analysts talk endlessly on financial television about low interest rates “justifying” current valuations, without completing the story that even if this were true (and it’s not - see the links below), these rich valuations still imply predictably dismal future returns on stocks, particularly on a 10-12 year horizon. The fact is that the relationship - the direct mapping - between the most historically reliable valuation measures and actual subsequent market returns hasn’t changed a bit in nearly a century.
Hussman Funds - Weekly Market Comment: Run-Of-The-Mill Outcomes vs. Worst-Case Scenarios
My LT chart based on many data inputs....
IWM - SharpCharts Workbench - StockCharts.com
robo
TSP Legend
- Reaction score
- 471
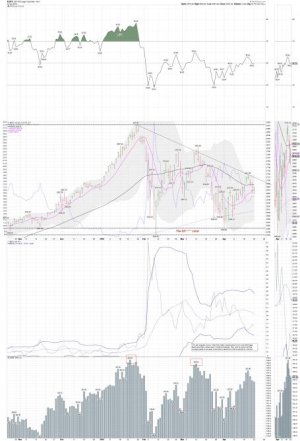
Why watching IWM and the NYSE is very important during long in the tooth Bull Markets. Watch for lower highs. Once they are seen ( markers printed) stay more nimble in your trading or moves in your TSP account. Bull markets are excellent for trend traders and long term investors, and Bear Market are great for swing trading.
Have a nice weekend.
2000
$SPX | SharpChart | StockCharts.com
2007
$SPX | SharpChart | StockCharts.com
2018
$SPX | SharpChart | StockCharts.com
Gold and the Miners...
GLD | SharpChart | StockCharts.com
2007 and gold...
$SPX | SharpChart | StockCharts.com
http://www.traders-talk.com/mb2/index.php?/topic/169199-patience/
Last edited:
robo
TSP Legend
- Reaction score
- 471
Robo! Long time, buddy.
It has been awhile since my last post. I stop in a few times a week to look things over. I always enjoyed reading over your market thoughts.
GLD | SharpChart | StockCharts.com
$SPX | SharpChart | StockCharts.com
nnuut,
My attached images are hard to see. Is there a way to make them larger when I post them?
https://seekingalpha.com/author/viking-analytics/articles#regular_articles
https://seekingalpha.com/author/hebba-investments/articles#regular_articles
https://seekingalpha.com/author/steven-jon-kaplan/articles#regular_articles
https://www.jeffclarktrader.com/market-minute/archives/
Attachments

Last edited:
robo
TSP Legend
- Reaction score
- 471
I'm currently long silver.
USLV | SharpChart | StockCharts.com
Sentiment Speaks: The Metals Manipulators Are Being Manipulated
Summary
GLD has the potential to outpace the market this year.
Please do not use manipulation as an excuse in the metals market.
Upcoming expectations for GLD.
This idea was discussed in more depth with members of my private investing community, The Market Pinball Wizard.
For those that follow me regularly, you will know that I have been tracking a set-up for the SPDR Gold Trust ETF (NYSEARCA:GLD), which I analyze as a proxy for the gold market. I also believe that gold can outperform the general equity market once we confirm a long-term break out has begun, and I still think we can see it in occur in 2018. This week, I will provide an update to GLD. While I have gone on record as to why I do not think GLD is a wise long-term investment hold, I will still use it to track the market movements.
But, before I give you my broad view of the GLD, I just want to make a point about silver.
https://seekingalpha.com/article/4165017-sentiment-speaks-metals-manipulators-manipulated
Last edited:
robo
TSP Legend
- Reaction score
- 471
I trade using Sentiment and cycles...
Bearish Shift for Stocks
Stocks broke lower on Tuesday shifting the odds towards a left translated daily cycle formation.
Tuesday was day 16 for the daily equity cycle. Had stocks broke higher on Tuesday that would have allowed us to construct the daily cycle trend line. Instead, stocks broke lower to close back in the volatility zone. Stocks also lost the 10 day MA and closed below the lower daily cycle band. Closing below the lower daily cycle band continues the daily downtrend. It also signals that the intermediate cycle is in decline. A left translated daily cycle formation will assure us of a left translated weekly cycle formation. And a left translated weekly cycle formation impacts our yearly cycle framework, which I will discuss in this week’s Weekend Report.
https://likesmoneycycletrading.wordpress.com/2018/04/24/bearish-shift-for-stocks/
$SPX | SharpChart | StockCharts.com
robo
TSP Legend
- Reaction score
- 471
I will be trading TQQQ...
TQQQ | SharpChart | StockCharts.com
The Final Decline of the Correction
Published April 25, 2018 - 7:30 AM
The stock market ran into resistance this week, and now it’s turned back.
It looks like the bear is taking another swipe at stocks – sending them back down to their February lows… or below.
The good news is this should be the final wave for this correction. The bad news is there’s no telling what price level this wave will end at…
More...
https://www.jeffclarktrader.com/market-minute/the-final-decline-of-the-correction/
robo
TSP Legend
- Reaction score
- 471
Minor Opportunity
by likesmoneystudies
The Miners formed a swing low on Thursday.
https://likesmoneycycletrading.wordpress.com/2018/04/26/minor-opportunity/
by likesmoneystudies
The Miners formed a swing low on Thursday.
https://likesmoneycycletrading.wordpress.com/2018/04/26/minor-opportunity/
robo
TSP Legend
- Reaction score
- 471
This could be the most important chart of the century for investors
Published: Apr 26, 2018 2:08 p.m. ET
https://www.marketwatch.com/story/t...chart-of-the-century-for-investors-2018-04-26
NASA's $1 billion mission to Jupiter may end this summer — here are the best images Juno has taken of the giant planet so far
NASA Juno probe's best photos of Jupiter before last planned orbits - Business Insider
robo
TSP Legend
- Reaction score
- 471
We shall see! Waiting for the dollar to make it's next move... Long USLV and GDXJ....
Patience is a rare quality
During sideways markets like we’re in now the key to making money is patience. But let’s face it, most of you don’t have it, never had it, and are never going to have it. The average retail trader is a gambler always looking for the next trade no matter how poor the setup is. It’s why most people never make any long term money in the market. They over trade.
The current market environment isn’t conducive to trading right now. It’s very volatile and whipsawing. The best course of action is to let the market finish it’s consolidation and set up for the next leg up to 10,000. Unfortunately very few people will be able to follow that advice. They will jump in and get knocked out of the market over and over as they try to force trades in an erratic market. All they will accomplish is to lose money and have less to work with when the real move begins.
More...
https://blog.smartmoneytrackerpremium.com/
$GOLD | SharpChart | StockCharts.com
$SPX | SharpChart | StockCharts.com
Last edited by a moderator:
robo
TSP Legend
- Reaction score
- 471
The SPX needs to get back above the 10 dma and then the 50 dma.... Traders need to stay nimble and not place big bets long or short in my opinion.....
The whipsaws are going to continue I think.... The edge/odds are still with the Bulls over all, but one should still remain nimble. This is not the same market we traded in last year...
$SPX | SharpChart | StockCharts.com
The 4/29/18 Weekend Report Preview
by likesmoneystudies
Stocks formed a bullish reversal on Wednesday followed by printing swing low on Thursday, allowing us to label Wednesday as the half cycle low.
The formation of the half cycle low allows us to construct the daily cycle trend line. However since stocks closed below the lower daily cycle band this week, that signals that the intermediate cycle is in decline. Therefore any rally out of the HCL should remain lower than the previous daily cycle high of 2801.90
https://likesmoneycycletrading.wordpress.com/2018/04/29/the-4-29-18-weekend-report-preview/
robo
TSP Legend
- Reaction score
- 471
ANALYSIS, PERSPECTIVE, TRADING STRATEGY
A BULLISH ROBOT ALGO SNEAK ATTACK MAY BE NEAR
by Joe Duarte, April 29, 2018
I may be overplaying the contrarian card, but it looks as if the most under-loved stock market in the past eighteen months is setting up for what could be a fairly profitable trading rally. That’s because a little followed, simple technical indicator is flashing a bullish alert which the quants, the fundamentalists, the hedge funds, the mutual funds, the pension funds, the central banks and the CFA crowd of analysts and traders may be ignoring altogether.
https://www.joeduarteinthemoneyoptions.com/reports/TA.asp
QQQ | SharpChart | StockCharts.com
$SPX | SharpChart | StockCharts.com
robo
TSP Legend
- Reaction score
- 471
Gold: Could I Be Wrong?
Summary
Gold – proxied by iShares Gold Trust ETF IAU - has come under renewed downward pressure since mid-April.
I present two key risks to my friendly outlook for IAU.
Despite these two risks, I argue that the macro backdrop for IAU should be sweet this year, leaving the uptrend in IAU intact.
https://seekingalpha.com/article/4167528-gold-wrong?app=1&uprof=46&isDirectRoadblock=true
GLD | SharpChart | StockCharts.com
I added another small tranche of USLV at the open.
SLV | SharpChart | StockCharts.com
Dear .....
The following order executed on 04/30/2018 at 9:31 AM, Eastern time:
Account: xxxx
Transaction type: Buy
Order type: Limit
Security: CREDIT SUISSE AG NASSAU VELOCITY SHS ETN 3X LONG SILVER S&P GSCI NEW (USLV)
Quantity: 500 share(s)
Price:* $9.59
Clive likes silver too....
https://www.clivemaund.com/article.php?id=67
Last edited:
robo
TSP Legend
- Reaction score
- 471
Posted on April 30, 2018
Miner Rejection
The dollar did form a daily swing high on Monday. A peak on day 8 does potentially set up a left translated daily cycle formation. However the dollar also closed higher on Monday.
So here is what we are looking for:
1) A swing low on the Miners to signal the daily cycle low.
2) Then a close above the triple resistance of the 200 day MA, 10 DMA and the declining trend line.
2) Bearish follow through on the dollar sending it into its daily cycle decline.
https://likesmoneycycletrading.wordpress.com/2018/04/30/miner-rejection-2/
robo
TSP Legend
- Reaction score
- 471
Sell in May? I don't use this data for trading, but some do. I'll be trading both ways, and when I like the setup I buy VXF or the S Fund. The VXF index is free trades at Vanguard. You can buy anytime during the trading day in real time.
https://investor.vanguard.com/investing/trading-fees-commissions
Introduction
Sy Harding introduced his seasonal MACD strategy in his 1999 book, Riding the Bear. Note that the S&P 500 peaked a year after this book came out. Hardings seasonal MACD strategy combines the six-month seasonal cycle from the Stock Trader's Almanac and momentum using MACD, which was developed by Gerald Appel. Basically, MACD is used to confirm or trigger bullish and bearish signals within the guidelines of the six-month cycle. According to the Stock Trader's Almanac, using MACD greatly increased the profitability of the seasonal system and reduced risk.
Buy Signal Recap:
Buy on October 16th if MACD is bullish.
Wait for bullish MACD signal if MACD is not bullish on October 16th.
Sell Signal Recap:
Sell on April 20th if MACD is bearish
Wait for a bearish MACD signal if MACD is not bearish on April 20th.
Six-Month Cycle MACD [ChartSchool]
$SPX | SharpChart | StockCharts.com
VXF or the S Fund...
VXF | SharpChart | StockCharts.com
https://personal.vanguard.com/us/fu...t=INT&FundId=0965&funds_disable_redirect=true
robo
TSP Legend
- Reaction score
- 471
A Golden Opportunity
Published May 02, 2018 - 7:30 AM
Gold has had a tough few weeks.
After peaking just above $1,360 per ounce in early April, the price of the shiny yellow metal has crumbled. It traded as low as $1,303 yesterday.
That’s a decline of more than 4% in just about three weeks. OUCH.
t seems far more likely, to me at least, that any further decline in the price of gold is likely to find support near $1,295. Then it will start the next rally attempt. And – should that rally push gold above the resistance line at about $1,365 – it could kick off a longer-term bullish move towards the $1,580 level.
It has been tough for holders of gold to watch the price decline over the past few weeks. But that decline is temporary.
Gold is likely to be much higher by the end of the year than where it is today. Traders should take advantage of short-term weakness to buy intermediate-term positions.
Best regards and good trading,
https://www.jeffclarktrader.com/
$GOLD | SharpChart | StockCharts.com
nnuut
Moderator | TSP Talk Royalty
- Reaction score
- 210
robo
TSP Legend
- Reaction score
- 471
The odds are getting much better for a nice bounce for the metals/miners... This sector is a tough one to trade...
USLV | SharpChart | StockCharts.com