Bear Cave 2 (Bull Allowed)

Timing Band

Posted on January 11, 2016

Monday was day 37 for the daily equity cycle. That places stocks in their timing band to print a daily cycle low.

This week 20 for the intermediate equity cycle. Stocks are now in their timing band to print an intermediate (weekly) cycle low. After a scary drop last week there is a lot of fear that stocks will keep on dropping. If an intermediate cycle low were to form here, that would likely catch many on the wrong side of the trade. Since stocks have printed a lower low already, the earliest a weekly swing low can form will be next week. Then a close above the lower weekly cycle band would indicate a new intermediate cycle.

https://likesmoneycycletrading.wordpress.com/author/likesmoneystudies/
 
The 1/12/16 Morning Report

Posted on January 12, 2016


Last night we discussed how stocks are in their timing band to print a daily cycle low. This morning I want to take a look at another indicator of a cycle bottom.


Two observations:

1.) A spike in the NY Lows is a good indicator that a bottom is near.
2.) A spike to this level usually spots a major bottom.


https://likesmoneycycletrading.wordpress.com/author/likesmoneystudies/


IWM - SharpCharts Workbench - StockCharts.com

$NYA - SharpCharts Workbench - StockCharts.com

$NYMO - SharpCharts Workbench - StockCharts.com

GLD - SharpCharts Workbench - StockCharts.com
 

Attachments

  • robo1.jpg
    robo1.jpg
    79.7 KB · Views: 123
A very rough start for 2016. I bought my 4th tranche Friday at the close using our 401k money. The S Fund ( TSP account) was my first tranche (VXF) and I added 3 additional tranches so far using VUG. My first tranche is always my TSP because of the rules they impose on us. I then scale in with a 3 to 4 more buys as we move lower. A loser for now, but I think we are close to a bounce. I'll be using FIFO and move my TSP funds back to the G Fund first and sell the reaming 3 or 4 tranches of VUG based on market data. My TSP account is a small part of my investment money, but I like the G Fund and make moves when I see extremes. However, we all know oversold can get a heck of a lot more oversold and that's why I scale in. If you are only a investor or stay in the G Fund most of the time then the TSP account is the Best in my opinion once you retire. For what I like to do I like Vanguard. I keep some of my money in the G Fund because of the safety and returns beat most cash funds.

Again, I like our Vanguard account.

https://personal.vanguard.com/us/whatweoffer/stocksbondscds/feescommissions

https://personal.vanguard.com/us/funds/etf/all

I'm still in the Bear Market camp for the next few years, but I think we will have some nice trading ops this year. So far that is not working out!

I'll add one more tranche of VUG if we move down again Monday. That will put me at/around 25% of my total investment money long on this move.

Good luck to all next week if you are trading.

I mainly trade the miners...GDX and GDXJ!

$SPX - SharpCharts Workbench - StockCharts.com

IWM - SharpCharts Workbench - StockCharts.com

$NAMO - SharpCharts Workbench - StockCharts.com

http://stockcharts.com/h-sc/ui?s=$NYMO&p=D&b=5&g=0&id=p44763076325&a=440302856

http://stockcharts.com/h-sc/ui?s=GLD&p=D&yr=0&mn=3&dy=20&id=p18044823249&a=440704681
 
Last edited:
The 1/15/16 Weekend Report Preview

Posted on January 17, 2016

Stocks broke below the August intermediate cycle low, forming a failed intermediate cycle.

Friday was day 41 for the daily equity cycle. That places stocks in their timing band to print a daily cycle low. The large Buying on Weakness days on Wednesday and Friday suggest that the cycle low is near. Stocks need to form a swing low and deliver a declining trend line break to signal a new daily cycle.


http://imagizer.imageshack.us/a/img903/6295/vZ1lOg.jpg

https://likesmoneycycletrading.wordpress.com/author/likesmoneystudies/
 
January 18, 2016
An Imminent Likelihood of Recession


While I’m among the only observers that anticipated oncoming recessions and market collapses in 2000 and 2007 (shifting to a constructive outlook in-between), I also admittedly anticipated a recession in 2011-2012 that did not emerge. Understand my error, so you don’t incorrectly dismiss the current evidence. Though not all of the components of our Recession Warning Composite were active in 2011-2012, I relied on an alternate criterion based on employment deterioration, which was later revised away, and I relied too little on confirmation from market action, which is the hinge between bubbles and crashes, between benign and recessionary deterioration in leading economic data, and between Fed easing that supports speculation and Fed easing that merely accompanies a collapse.

Hussman Funds - Weekly Market Comment: An Imminent Likelihood of Recession - January 18, 2016


I'm still long VXF (S Fund) and VUG. I added another tranche Friday at the close. I'm long for a possible multi-day oversold bounce only. So far early and wrong!


$SPX - SharpCharts Workbench - StockCharts.com

VXF - SharpCharts Workbench - StockCharts.com

VUG - SharpCharts Workbench - StockCharts.com

$NAMO - SharpCharts Workbench - StockCharts.com


Miner trading.....

Long GDXJ again.....

http://stockcharts.com/h-sc/ui?s=GDXJ&p=D&yr=0&mn=6&dy=0&id=p91332462266&a=440704889

http://stockcharts.com/h-sc/ui?s=GDX&p=D&yr=0&mn=6&dy=0&id=p03406292009&a=440705022

http://stockcharts.com/h-sc/ui?s=UUP&p=D&yr=1&mn=0&dy=0&id=p46635069470&a=440707023

http://stockcharts.com/h-sc/ui?s=GLD&p=D&yr=0&mn=3&dy=20&id=p18044823249&a=440704681
 
A very small excerpt from one of Steve Kaplan's updates.

Update #2146: Wednesday night, January 13, 2016: Commitments 2016-1-8; right after wrong

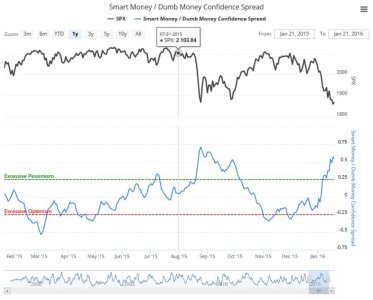
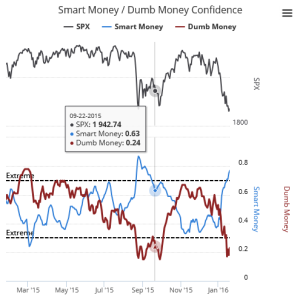
Lately there have been sudden outflows from many funds of U.S. risk assets. These outflows will tend to be sharpest near any intermediate-term bottom, while there will continue to be meaningful inflows near all rebound highs as many investors become convinced that the worst is over and that they should buy in dips because that is what they should have done and didn't do during most of the past several years. As is always the case in the early stages of any bear market, investors have learned the wrong lessons too late. Investors won't stop buying into rebounds until the stock market is truly near its ultimate bottom, when they will be terrified about buying anything because of a sequence of a dozen or so lower lows which will have been attained by then.


True Contrarian


Fair Value, Like A Reliable But Tardy Guest, Is Always Late And Always Arrives

Jan. 8, 2016 2:23 PM ET


Many investors like to repeat John Maynard Keynes' overquoted quip about how the market can remain irrational longer than you can remain solvent. There are numerous problems with this saying, especially when taken out of context, since as long as you don't use margin you should always remain solvent. Those who go overboard with investing, as with anything else in life, will sometimes be rewarded in the short run but will inevitably fail in the long run. Those who bet on extremes becoming more extreme will similarly often prosper for some unknown period of time, but will eventually lose in the end because all assets eventually revisit fair value. After doing so, whatever had been previously wildly trendy and overvalued usually ends up becoming roughly equally despised and underpriced.


Fair Value, Like A Reliable But Tardy Guest, Is Always Late And Always Arrives | Seeking Alpha
 
Last edited:
“When oversold stays oversold” – Look ahead for the week of 01/22/2016

Just 2 weeks into the year and it already feels like an entire year’s trading range. Just brutal to say the least. Oversold readings have become more oversold. Market breadth is horrendous although some small positive divergences are creeping in for a very short term bounce which most certainly may not stick. Panic everywhere with Equity-Only Put call ration and CBOE Volatility Index beginning to move higher. Highly correlated market action with oil since the last month or two while China continues to devalue its currency. Global Economies are in the brink of a recession while Fed continues to make decisions on further rate hikes. Every equity index in the world now trading below their 200-day moving average. All the news headlines which I avoid reading are flashing a ton of input on how the crashes were in 1987 or be it 2008.

?When oversold stays oversold? ? Look ahead for the week of 01/22/2016 ? Venky Srinivasan | Only price pays!!! Trend is your friend!!!
 
Will it be a gap up and crap today or a multi-day move up for stocks? We shall see because it remains very Bearish out there, and doesn't even matter to investors or traders making MT positions.

I remain Long VUG and ( VXF - S Fund). I bought 5 tranches and it remains a loser for now. My TSP is always the first tranche in and the first out (FIFO) because of the TSP restrictions. I normally buy 3 or 4 tranches when scaling in for a long position. Something one can't do using our TSP accounts. It's designed for LT investors not trading/market timing. It's still excellent overall for investors.

VXF - SharpCharts Workbench - StockCharts.com

VUG - SharpCharts Workbench - StockCharts.com

I'm still trading GDXJ and it remains a very tough sector to trade.

GDXJ - SharpCharts Workbench - StockCharts.com


I'm using Roth IRA's at Scottrade to trade the miners....

GLD - SharpCharts Workbench - StockCharts.com


Still scaling in and adding tranches this morning.

1/19/2016 7:58:05 AM ET GDXJ Bought GDXJ @ $18.03 Executed
1/19/2016 7:55:59 AM ET GDXJ Bought GDXJ @ $18.05 Executed
1/19/2016 8:44:17 AM ET GDXJ Bought GDXJ @ $17.98 Executed
 
Last edited:
Last edited:
Another rough opening today for investors holding this move down!

Stocks.....long VUG and (VXF = S Fund) Long and wrong....


$TICK - SharpCharts Workbench - StockCharts.com

$NYMO - SharpCharts Workbench - StockCharts.com

VXF - SharpCharts Workbench - StockCharts.com

$SPX - SharpCharts Workbench - StockCharts.com

VUG - SharpCharts Workbench - StockCharts.com


Miners...long GDXJ

GLD - SharpCharts Workbench - StockCharts.com

http://stockcharts.com/h-sc/ui?s=GDXJ&p=D&yr=0&mn=8&dy=0&id=p33584940284&a=441638138


http://stockcharts.com/h-sc/ui?s=UUP&p=D&yr=1&mn=0&dy=0&id=p46635069470&a=440707023

http://stockcharts.com/h-sc/ui?s=$HUI:GLD&p=D&yr=1&mn=0&dy=0&id=p94577698317&a=440704908

http://stockcharts.com/h-sc/ui?s=GDX&p=D&yr=0&mn=7&dy=0&id=p62629672306&a=440705022

January 19, 2016, 3:45 P.M. ET
.
Gold Prices Ripe for ‘Mega Short Squeeze,’ Fund Manager Says

http://blogs.barrons.com/focusonfun...ipe-for-mega-short-squeeze-fund-manager-says/


A excerpt from one of Kaplan's updates"

Brief update, 1-20-2016: The world is probably not ending.

In a sea of nearly complete negativity, it is important to remember that the financial markets in the long run are always a rebalancing mechanism, rewarding whichever assets have become the most lightly represented while punishing those which have become heavy investor favorites. As Benjamin Graham had wisely said in 1934, "In the short run, the market is a voting machine, but in the long run it is a weighing machine."

http://truecontrarian-sjk.blogspot.com/
 
Last edited:
The 1/21/16 Morning Report
by likesmoneystudies


Stocks appear to be in the process of forming a bullish weekly reversal which will ease the parameters for forming a weekly swing low. With stocks in their timing band for an intermediate low, a new daily cycle could also signal a new weekly cycle. Following a weekly swing low, a weekly close above the lower weekly cycle band will signal a new intermediate cycle.

https://likesmoneycycletrading.wordpress.com/author/likesmoneystudies/
 

Attachments

  • Likesmoney1.jpg
    Likesmoney1.jpg
    65.1 KB · Views: 117

Attachments

  • st1.jpg
    st1.jpg
    55.7 KB · Views: 114
  • st2.png
    st2.png
    57.4 KB · Views: 113
Last edited:
Energy
by likesmoneystudies

Both oil and energy printed their lowest point on Thursday after an extended decline. Thursday was day 24 for oil and day 19 for XLE. This places oil one day shy of its timing band for a daily cycle low, while it places XLE in its timing band for a daily cycle low.

Both formed a swing low today to signal a new daily cycle. Now a break of the daily cycle trend lines will confirm a new daily cycle for both.

NATGAS also formed a swing low on Thursday.


https://likesmoneycycletrading.wordpress.com/author/likesmoneystudies/
 

Attachments

  • LM1.jpg
    LM1.jpg
    70.3 KB · Views: 117
One Last Chance for the Bulls to Take Charge
By Jeff Clark
Thursday, January 21, 2016

The next seven trading days will determine the market’s fate.

All of the major averages are down sharply from last May’s highs, and much of that damage occurred in just the past three weeks.

But we can’t give up on the bull market yet – at least, not until the end of the month…

Take a look at the following monthly chart of the S&P 500 plotted against its 20-month exponential moving average (EMA)…

This is important because even if the market doesn’t snap back right away this time, it will rally at some point. And it’s normal for the market to come back and test its breakdown level. So we’re likely to see the S&P 500 rally back up to its 20-month EMA line at some point. I’m betting it happens sooner rather than later.

Best regards and good trading,

Jeff Clark

One Last Chance for the Bulls to Take Charge
 

Attachments

  • Jeff1.png
    Jeff1.png
    31.4 KB · Views: 123
January 25, 2016
Wicked Skew: When Extreme Losses are Standard Outcomes


Presently, I view the likelihood of a U.S. recession as high. In light of the hostile market return/risk profile associated with present market conditions, I also increasingly suspect that the initial part of the completion of the current market cycle (though not the full completion) may emerge in the form of a nearly vertical loss, with a material break of the highly-monitored 1820 area on the S&P 500 as a likely catalyst for concerted selling by trend-following investors. A fairly run-of-the-mill outcome, in the context of present conditions, would be a further vertical retreat on the order of 14% following that break. Such a decline would take the S&P 500 to about 1560, which is interesting because that’s a widely followed level corresponding to the 2000 and 2007 market peaks. I doubt that the full market cycle would be completed by such loss, but even the most severe bear markets have had an ebb-and-flow that typically punctuates periods of decline with periods of stabilization and advance.

Hussman Funds - Weekly Market Comment - Wicked Skew: When Extreme Losses are Standard Outcomes - January 25, 2016
 
How to Trade Today's Volatile Market
By Jeff Clark
Tuesday, January 26, 2016

The charts are a mess.

The steep decline in the stock market so far this year has caused a lot of technical damage to all the indexes and most stocks. It's going to take several weeks of back-and-forth, choppy action to give stocks a chance to settle down and offer any sort of tradable pattern.


If the stock market is transitioning from bullish to bearish, the volatile, choppy action we've seen over the past month is going to persist for several more months (at least). The daily charts won't do us much good. Learning to trade off the intraday movement in stocks will give you a good chance to profit.

Best regards and good trading,

Jeff Clark

Growth Stock Wire | Stock Market Analysis, Market News & Stock Picks
 
Back
Top