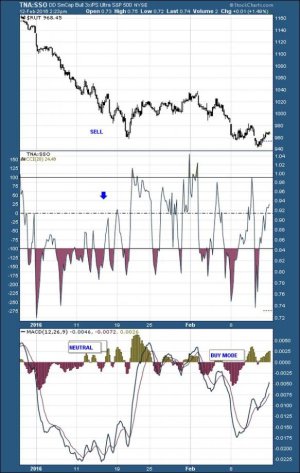
Some of the charts I use to trade.
GLD - SharpCharts Workbench - StockCharts.com
SLV - SharpCharts Workbench - StockCharts.com
GLD - SharpCharts Workbench - StockCharts.com
$NAMO - SharpCharts Workbench - StockCharts.com
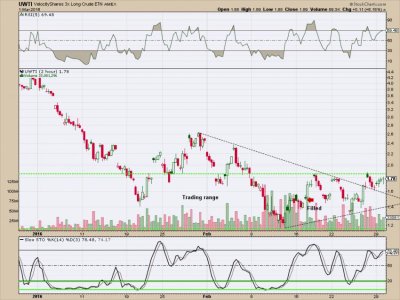
UWTI - SharpCharts Workbench - StockCharts.com
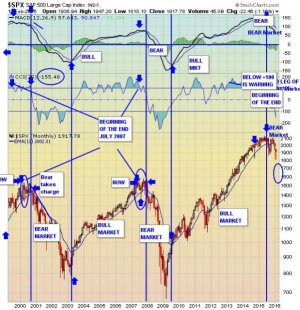
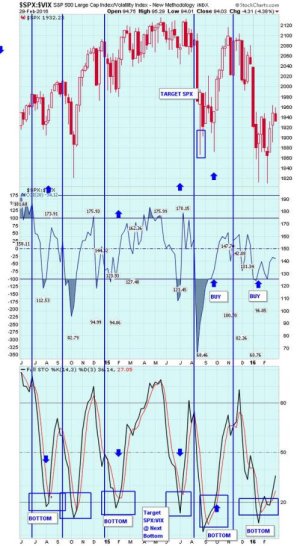
http://stockcharts.com/h-sc/ui?s=$SPX&p=D&yr=0&mn=8&dy=0&id=p05166893292&a=445248271
http://stockcharts.com/h-sc/ui?s=GDX&p=D&yr=0&mn=7&dy=0&id=p19978342179&a=444286189
http://stockcharts.com/h-sc/ui?s=GDX&p=W&yr=4&mn=7&dy=0&id=p75286166752&a=444287242
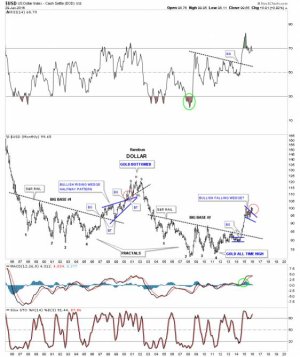
http://stockcharts.com/h-sc/ui?s=UUP&p=D&yr=1&mn=0&dy=0&id=p46635069470&a=444286350
Expect Huge Price Swings Next Month
By: Chris Vermeulen | Sat, Feb 20, 2016
This past week was not for the 'faint of heart'. All of the asset classes witnessed wildly volatile moves, which culminated in an 11% move of crude oil. The U.S. equity markets survived a scare on Friday, February 12th, 2016 and moved up sharply. Gold returned as a safe haven for investments. The uncertainty of further rate hikes, by the FED, has turned the U.S. dollar into a range-bound trade.
http://www.safehaven.com/article/40521/expect-huge-price-swings-next-month
http://www.kereport.com/2016/02/20/state-economy/
A small excerpt from Steve Kaplan:
This is update #2150 for Friday late afternoon, February 19, 2016.
Negative interest rates have become such a popular topic of discussion that I have to believe we are set for a period of unexpected increases for long-term bond yields worldwide. As usual, the timing of any news story is often more important than the information itself. If everyone is worried about negative interest rates now, then it might be a serious problem in the future but the market will move in the opposite direction for a sustained period of time during the next year or two. Once everyone is “proven wrong” and changes their minds, they will subsequently be proven right:
Because of negative interest rates in Europe, the European Central Bank is considering the elimination of the 500-euro note because it is tempting to put money in actual cash rather than to hold it in an account which gets no interest and is charged fees. The U.S. still doesn’t generally suffer from negative nominal yields, but no doubt the Fed will have to consider the possibility if we have a severe recession because there is almost no room to cut rates from their current absurdly low levels. The usual excuses about “criminals” and other such nonsense are merely a cover for a much greater concern that money sitting literally in cash is especially unproductive for the economy:
http://truecontrarian-sjk.blogspot.com/
Good luck to those trading these markets.
TSP investors enjoy the show...It's going to get better in my opinion!
Quick Look At Futures Positioning
Published: Feb 19 2016 at 02:52 PM CST | 0 Comments
Following is a quick snapshot of the latest futures positioning data from the CFTC. These are positions for the large commercial hedgers that we show in the interactive versions of the charts on the site.
The most notable change was in silver, where hedgers are now holding their most aggressive short positions since 2008. This is not always useful – it gave a bad warning sign in 2010 – but overall tends to be accurate. When commercials are heavily short a commodity in a downtrend, it has most often had difficulty sustaining higher prices, and they’ve been more aggressively shorting silver on each rally attempt over the past few years. As always, this could be misleading but it looks like the risk on silver just went up.
http://www.sentimentrader.com/blog/quick-look-at-futures-positioning
Chart found here.
https://twitter.com/SevenSentinels
SevenSentinels @SevenSentinels Feb 19
FINAL: MO: 8/2 REL:NSS HTT U/T 2/6 SS U/T 6/1 BR: -59/301
The 2/19/16 Weekend Report Preview
Posted on February 20, 2016
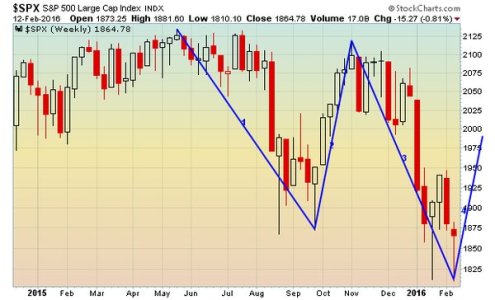
Since December stocks have been in a daily down trend characterized by lows forming below the lower daily cycle band and peaks occurring below the upper daily cycle band. Stocks will remain in a daily down trend until they can close above the upper daily cycle band. And a close above the upper daily cycle band will also confirm a new intermediate cycle.
https://likesmoneycycletrading.wordpress.com/author/likesmoneystudies/