Bear Cave 2 (Bull Allowed)

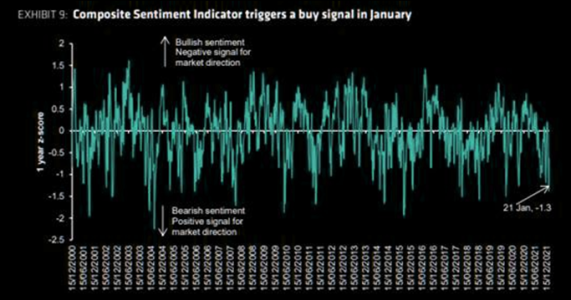
That Bernstein Buy signal...

"Investor sentiment dropped sharply in January with our short-term composite sentiment indicator hitting lows of -1.38 in the third week of January, the most bearish short-term sentiment reading since the worst of the pandemic volatility and a buy signal over the following 4-6 weeks. Our longer term, Cross border flow indicator has eased to a neutral level having flagged moderately bullish sentiment in the middle of last year. In the past, global equity returns have been around long-term average levels over the following 12 months when the indicator has been
https://themarketear.com/
 

Attachments

  • a.png
    a.png
    243.4 KB · Views: 51
Time to Hit Pause on This Strong Sector
Jeff Clark | Feb 7, 2022 | Market Minute | 2 min read
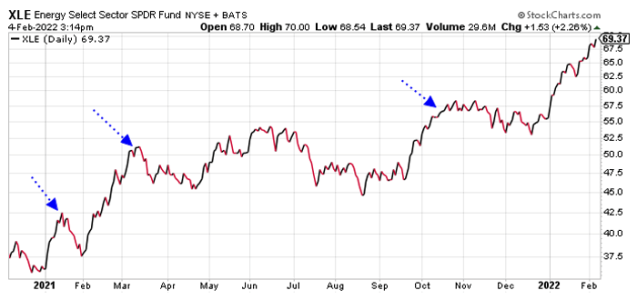
So far, 2022 is proving to be the year of the oil stocks.

The price of oil is up more than 20% over the past five weeks. At $92 per barrel, oil now trades at its highest price in over seven years…

And oil stocks have been on fire!

The Energy Select Sector Fund (XLE) – which holds a market basket of oil companies – is up more than 23% since the start of 2022. It’s up more than 53% over the past year.

And given the supply/demand pressures in the energy sector, oil and oil stocks are likely headed even higher in the months ahead.

But in the short term, they’re due for a pause.

Let me explain…

Regular readers might recall how we turned cautious on the energy sector last October. We weren’t outright bearish – just cautious.

Investor sentiment towards the energy stocks seemed too bullish for our comfort level.

And the Bullish Percent Index for the energy sector (BPENER) was at its highest level possible – meaning 100% of the stocks in the index were trading with positive technical patterns.

It’s not mathematically possible for the BPENER to get any better than that. So we figured if it can’t get any better, then it’s probably going to get worse… and suggested waiting a bit before buying the energy stocks.
https://www.jeffclarktrader.com/market-minute/time-to-hit-pause-on-this-strong-sector/
 

Attachments

  • a.png
    a.png
    23.1 KB · Views: 43
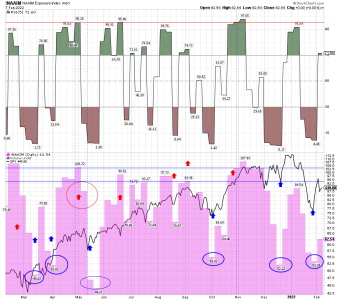
NAAIM weekly chart: I DO NOT use this data for trading. I just track it.
 

Attachments

  • a.png
    a.png
    56.5 KB · Views: 48
Ignore the media's attempt to explain the bear market for U.S. large-cap growth shares.


If you believe the media then you have to swallow the fairy tale that earnings are "driving" the market. What drives the market are valuations, not earnings. If profit growth is far out of line with price-earnings ratios in either direction then sooner or later there will be a regression toward the mean. The greatest deviations from the mean will eventually experience the most violent moves toward fair value and beyond. It's like a pendulum: if you pull it far from its equilibrium then it has no choice but to eventually swing sharply the opposite way, even if you pull it even farther away from the center in the short run.

Who is Steve Kaplan:

http://truecontrarian.com/Kaplan.mp4

True Contrarian
@TrueContrarian

17h
Most investors are either treating 2022 as though it'll be an approximate repeat of 2021 or else they believe that the investing world is totally different than it has ever been in the past. Both of these expectations are seriously flawed. See post https://truecontrarian-sjk.blogspot.com/2022/01/the-success-of-contrarian-strategies.html


My current total as of the close on Friday, February 4, 2022 was long 20.636% and short 42.13%, or almost exactly 1:2, not counting TLT. If the bear market continues for large-cap U.S. growth shares as I expect then I will likely be more long than short before the end of 2022. I list the exact percentages at the bottom of this essay.
https://truecontrarian-sjk.blogspot.com/
 
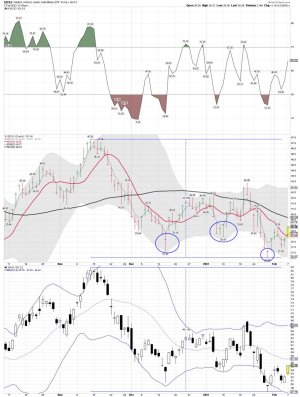
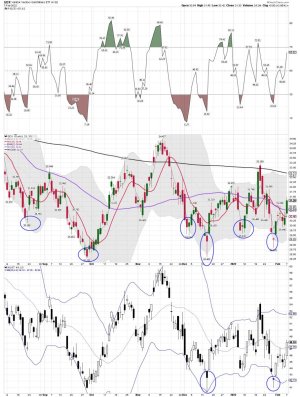
GDXJ daily: Moving up nicely..... The 50 sma be up next...

Long GDXJ
 

Attachments

  • a.jpg
    a.jpg
    149.8 KB · Views: 38
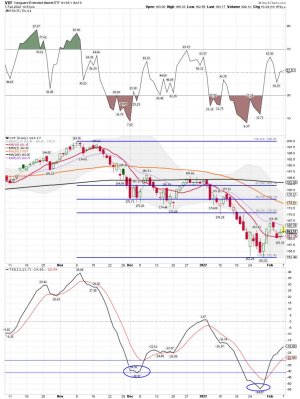
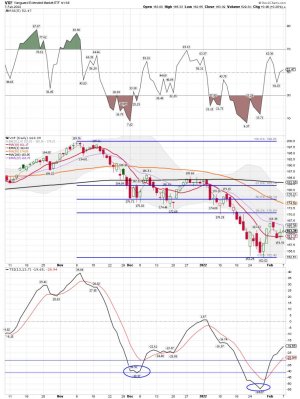
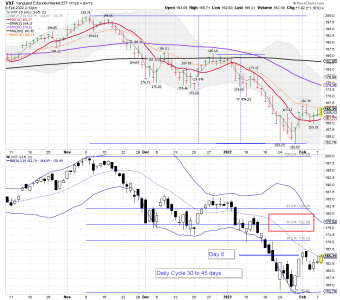
VXF daily: Odds increasing we will test the lows. Rejected at the 20 ema, but the 10 sma has held so far.


Long VXF, but with a smaller position.
 

Attachments

  • a.jpg
    a.jpg
    152.6 KB · Views: 37
GDXJ daily: Moving up nicely..... The 50 sma be up next...

Long GDXJ

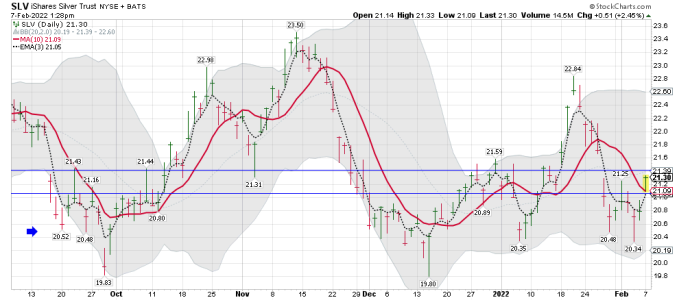
And SLV is up 2.5% today. That's a pretty big one day move for silver. SLV is now up testing the 50 day EMA, and may be looking to fill that open gap.

020722g.gif


No position at the moment.
 
"And SLV is up 2.5% today. That's a pretty big one day move for silver."

Back above the 10 sma.... Maybe it's final trying to bottom. In the long run I think gold, silver, and the miners will perform better then most stock indexes.
 

Attachments

  • a.png
    a.png
    35.5 KB · Views: 42
Jesse Felder
@jessefelder

2h
"I've been doing this 30 years and I've never seen markets like this. This is a molecule crisis. We're out of everything, I don't care if it's oil, gas, coal, copper, aluminum, you name it we're out of it."


Jesse Felder
@jessefelder
·
2h
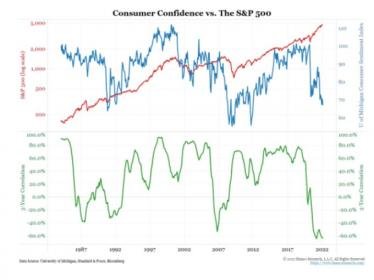
'All the indications are that the current bull market in stocks isn’t making consumers any happier and that the Fed should do as its mandates provide and prioritize attacking inflation.
https://twitter.com/jessefelder/status/1490714343536791557/photo/1

https://bloomberg.com/opinion/artic...-stocks-households?srnd=premium&sref=qpbhckVU
https://twitter.com/jessefelder
 

Attachments

  • a.jpg
    a.jpg
    23 KB · Views: 46
  • a.jpg
    a.jpg
    13.4 KB · Views: 47
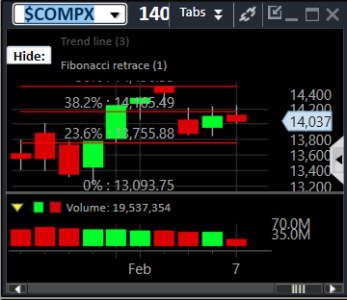
VXF after the close: Stopped at the 20 ema and so far unable to tag the 38.3 Fib level. Not what you want to see after a new daily cycle. Other indexes are also having trouble.

thomas
@VolumeDynamics

2h
F A I L U R E
thomas
@VolumeDynamics

2h
One of the ways to identify a BEAR MARKET RALLY is when it can't HOLD a .382R...
Quote Tweet
thomas
@VolumeDynamics
6h
Welp, it's like this, the .382R was TESTED and REJECTED at 14165, so unless $NASDAQ can climb over that 14165 resistance, there is nothing left to do but to test the TWIN LOWS at 13850-1
 

Attachments

  • a.png
    a.png
    24.3 KB · Views: 42
  • a.jpg
    a.jpg
    152.4 KB · Views: 52
"The correction lows are in" Maybe, and we shall see!

Long VXF

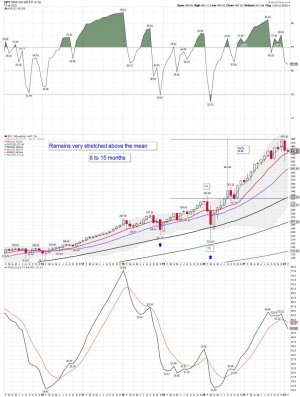
SPY monthly chart:

David Hunter
@DaveHcontrarian

5h
The correction lows are in.They occurred back on Jan 24.I do think the market has a little more downside work to do before resuming the melt-up.I think the downside risk is maybe 2% vs 30-40% upside.Sentiment is very bearish & investors are overly concerned about Fed tightening.
https://twitter.com/DaveHcontrarian?ref_src=twsrc^google|twcamp^serp|twgr^author
 

Attachments

  • a.jpg
    a.jpg
    151.2 KB · Views: 51
Last edited:
Miner Buy Signal

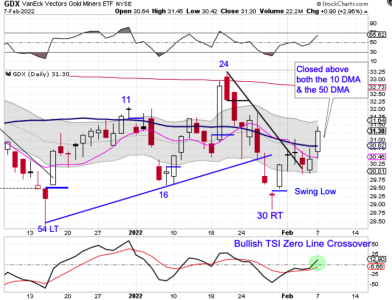
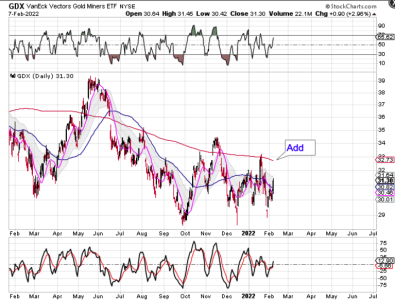
On Saturday we discussed that we were looking for a potential buy signal for the Miners. The Miners delivered that buy signal on Monday.

The Miners printed their l lowest point on day 30, placing them in their timing band for a DCL. We were looking for a close above both the 10 day MA and the 50 day MA to use as our buy signal to indicate that day 30 was the daily cycle low.

The next obvious area of resistance will be the declining 200 day MA. We will use a close above the 200 day MA as a place to add.

https://likesmoneycycletrading.wordpress.com/2022/02/07/miner-buy-signal-4/

Bottom Line: A move above the 10, and 50 sma on the GDX chart was the important point from the cycle dude. The trend remains up for now..... However, one of the toughest sectors out there to trade.
 

Attachments

  • a.png
    a.png
    141.4 KB · Views: 50
  • a.png
    a.png
    152.6 KB · Views: 52
  • a.jpg
    a.jpg
    163 KB · Views: 52
Due for a bounce with a couple of overhead gaps, but a bold move.

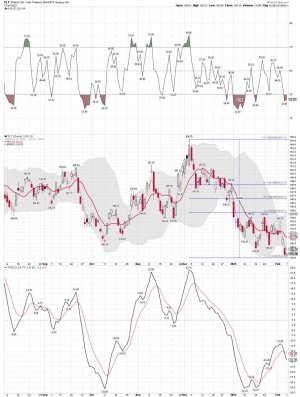
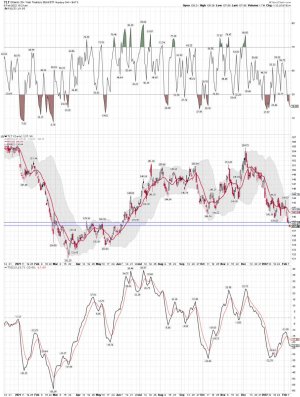
LOL..... It is indeed..... Lots of cash in my Vanguard account so thought I would try some TLT. Kaplan sure likes it..... We shall see how it plays out.

TLT has become very unpopular as investors don't trust a forty-year bull market.

One of my very first investments was purchasing long-dated U.S. Treasuries in 1981. At that time there was a nearly unanimous consensus that U.S. Treasury yields would keep climbing indefinitely due to permanently high inflation and soaring budget deficits. Each year, often more than twice per year even in the early 1980s, there was a proclamation that the bull market for the 30-year U.S. Treasury had ended, and we have continued to experience this gloom and doom each year since then including right now. On Friday, February 4, 2022, TLT dropped to 138.78 at 10:52:28 a.m. Eastern Time. I made my most frequent purchases of TLT on Friday since it had been even more depressed during the late winter and early spring of 2021. The longest-tenured writer at Barron's, Randall W. Forsyth, penned a bullish column about long-dated U.S. Treasuries which is the lead article in this week's print edition and can be found below:

https://truecontrarian-sjk.blogspot.com/2022/02/the-real-secret-to-investing-is-that.html

Vanguard account: Long GDXJ and TLT
 
VXF daily: Testing the 20 ema.... Still unable to move back up and tag the Fib 38.2% level. SO NO BEEF! I'm only going to be trading VXF at Vanguard as I wait to see how this Daily Cycle plays out. I think the ICL is in, but I don't take lots of risk these days. And when I do it's for a ST play after a confirmed DCL is in. We have that, but I just don't like the action. Maybe that is good for the wall of worry....

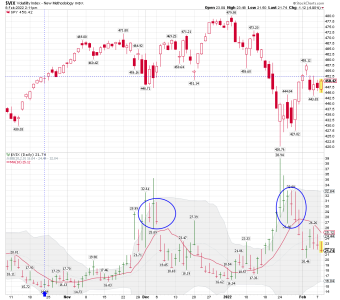
VIX daily:

Flat VXF after today.

Long GDXJ and TLT..... Short-term trading all kinds of stuff.... Both ways!
 

Attachments

  • a.png
    a.png
    37.8 KB · Views: 55
  • a.png
    a.png
    50.4 KB · Views: 56
Last edited:
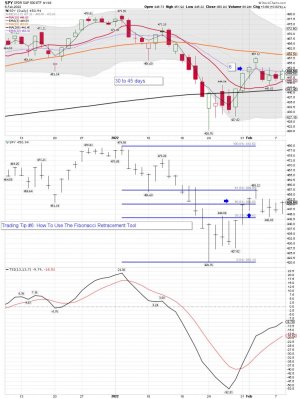
Daily cycle: Looks good so far.....

Market Consolidation Update
by likesmoneystudies

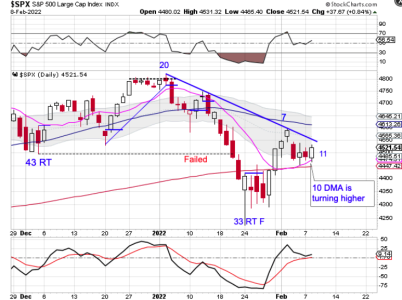
We discussed last week that the market probably needed to consolidate between the 50 day MA and the 200 day MA to allow the day 10 MA to turn higher.

Stocks closed higher on Tuesday turning the 10 day MA. higher. Now that the 10 day MA is turning higher, we are waiting on close above the 50 day MA so the daily cycle advance can gain some traction.

https://likesmoneycycletrading.wordpress.com/2022/02/08/market-consolidation-update/
 

Attachments

  • a.png
    a.png
    125.9 KB · Views: 55
  • a.jpg
    a.jpg
    153.2 KB · Views: 56
Back
Top