Bear Cave 2 (Bull Allowed)

Fed Caves On Tightenings
Jan. 29, 2022 1:43 AM

Summary
The Fed caved on its last quantitative-tightening attempt, abandoning it years early. Once that tightening forced stock markets to the verge of a new bear, the FOMC lost all courage.

The Fed reversed course abruptly to aggressive new easings. Fed officials talk a big game when stock markets are high, hawkishly jawboning away. But their threatened actions never live up.

With the SPX near records recently, Fed officials are proclaiming an imminent rate-hike cycle and new QT. While those tightenings will start, they will only last while stock markets cooperate.

With the SPX near record highs in recent months, Fed officials are boldly proclaiming an imminent rate-hike cycle and new QT. While the FOMC will start those tightenings, they will only last while stock markets cooperate. That likely won’t be long with valuations forced deep into dangerous bubble territory by the Fed’s epic QE4 money printing. These coming tightenings will be quickly abandoned when stocks plunge.

https://seekingalpha.com/article/44...m_source=seeking_alpha&utm_term=26528882.2325
 
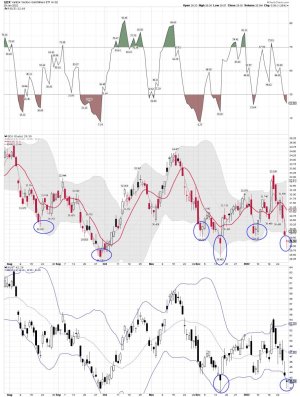
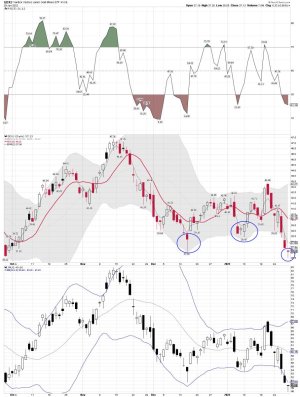
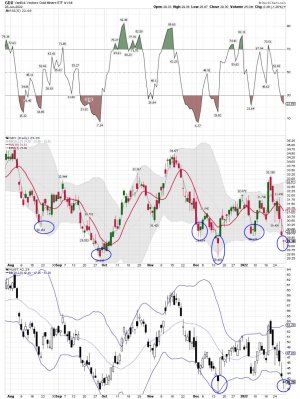
Gold miners: A "POSSIBLE" bounce next week as the Blood Bath for the miners was fast and deep last week!

Long GDXJ, EQX, and VXF

My trend trading system remains on a sell signal, as I continue to scale in and buy shares of GDXJ as it moves lower. I have NO IDEA how much lower the miners will go, but the patterns are looking like a possible bounce soon. As you can see by the lower BB tags and printing long tails on Friday. We shall see how these Hammer patterns play out next week.

Hammer
The hammer candlestick pattern is formed of a short body with a long lower wick, and is found at the bottom of a downward trend.
 

Attachments

  • gdx.jpg
    gdx.jpg
    157.4 KB · Views: 70
  • gdxj.jpg
    gdxj.jpg
    143.8 KB · Views: 71
  • a.jpg
    a.jpg
    155.2 KB · Views: 76
SentimenTrader
@sentimentrader

Small options traders spent $6.5 billion buying put options to open last week.

That's an all-time high.

Volatile intraday action, scary headlines, and a plunge in speculative stocks triggered panic that was 40% higher than even the worst week in March 2020.


Chart In Focus

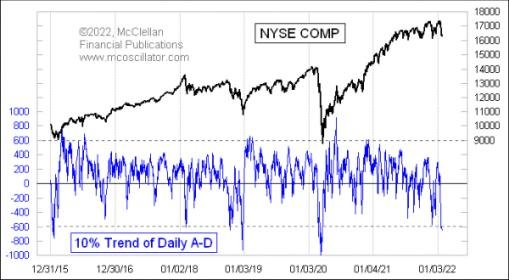
Another Oversold 10% Trend of Daily A-D When the 10% Trend of daily A-D gets down to below -600, it shows an oversold condition for the overall stock market. It is possible to get a lower reading than this, but that usually takes a Covid Crash or a Fed and crude oil induced selloff like what we saw in December 2018. The rest of the time, a reading like this is usually enough to mark at least a temporary end to a big selloff.
https://www.mcoscillator.com/learning_center/weekly_chart/another_oversold_10_trend_of_daily_a-d/
 

Attachments

  • a.jpg
    a.jpg
    30 KB · Views: 66
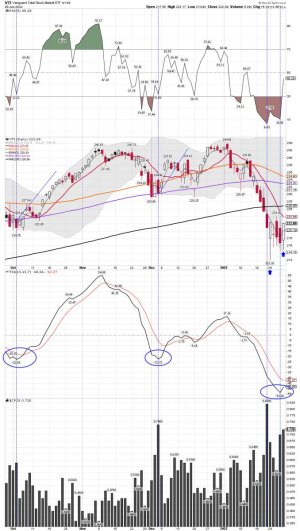
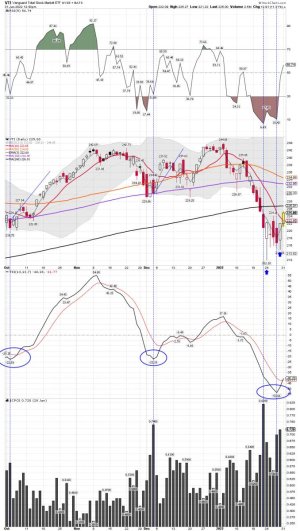
VTI daily and a possibe DCL: Back above the 3 ema on Friday so the 10 dma be up next. A gap up on "Easy Money Monday" would smoke some more of the shorts out of their positions and probably reduce the put/call ratio.

I might get a buy signal next week for VTI, but will it get whipsawed?
 

Attachments

  • a.jpg
    a.jpg
    135.7 KB · Views: 80
David Rosenberg
@EconguyRosie

Jan 28
In the span of four weeks, six negative daily Dow reversals of 1%+. This happened 99% of the time in the past in 1987 (crash); 1990 (recession), 1997-98 (Asian crisis); 2000-03 (tech wreck/recession), 2008-09 (GFC), 2018 (Powell!). All either ~20% corrections or 30%+ bear markets
https://twitter.com/EconguyRosie?lang=en
 
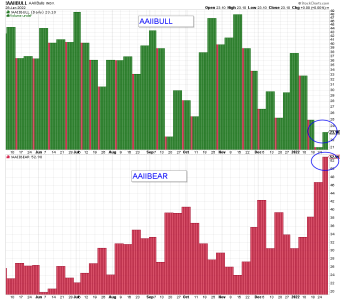
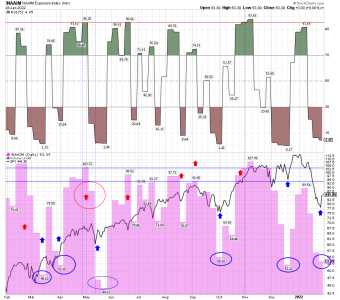
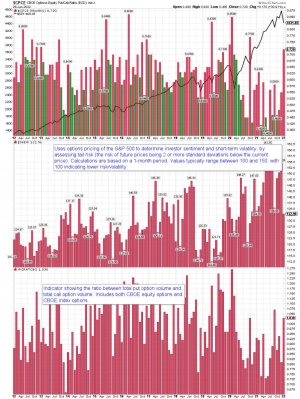
AAIIBULL/BEAR/NAAIM/PUT/CALL daily charts: For those that track Sentiment
 

Attachments

  • a.png
    a.png
    19.9 KB · Views: 64
  • a.png
    a.png
    54.8 KB · Views: 65
  • a.jpg
    a.jpg
    242 KB · Views: 70
Last edited:
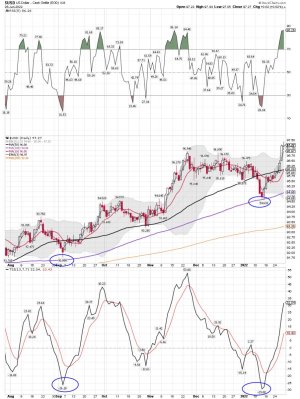
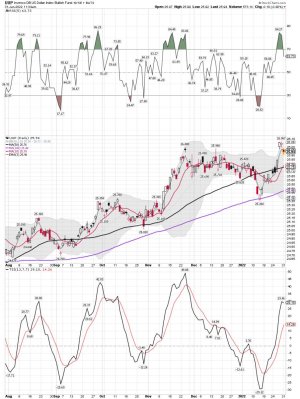
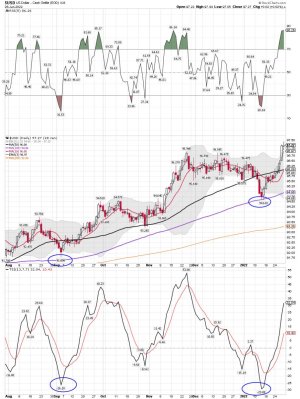
GDX/NUGT: I will be trading NUGT as we come out of the next DCL and then flip to GDX as we get deeper into the Daily Cycle. I will be trying to catch the first few days of the oversold bounce. Especially if this is an ICL. (STBD) We shall see if they smack stocks and gold down again once the futures open. I will be watching the dollar.

Long: GDXJ, EQX, and VXF
 

Attachments

  • a.jpg
    a.jpg
    170 KB · Views: 70
  • a.jpg
    a.jpg
    159.5 KB · Views: 69
Last edited:
When did you buy the dip is more important....

Yes I bought the dip and it was a tad early....

Did you buy the dip?
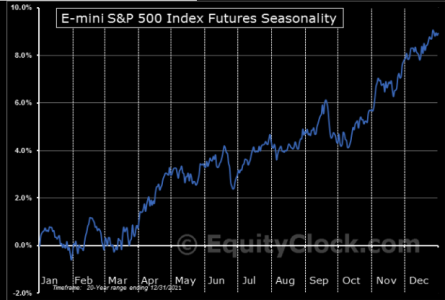
Slightly more bullish seasonality is supposed to kick in going forward, but then another set back later in February. So far it continues to work...
 

Attachments

  • a.png
    a.png
    86.7 KB · Views: 58
Just a consolidation within the bull market

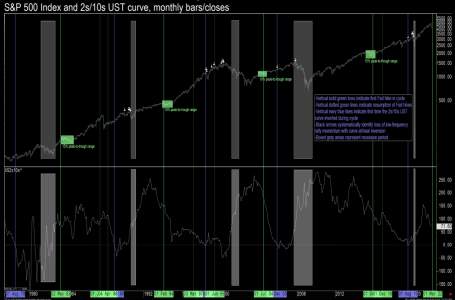
JPM technical analysis team compared the SPX and the US2/10 yield curve on a longer time horizon. They write; "market response to the initial removal of accommodative monetary policy in the last four economic cycles produced multi-month ranges with 10-15% peak-to-trough amplitudes. The current drop already covered that ground....current setback is similar to the 1983, 1994, 2004, and 2015 episodes, a consolidation within a bull market."

Did you buy the dip?

https://themarketear.com/
 

Attachments

  • a.png
    a.png
    182.2 KB · Views: 73
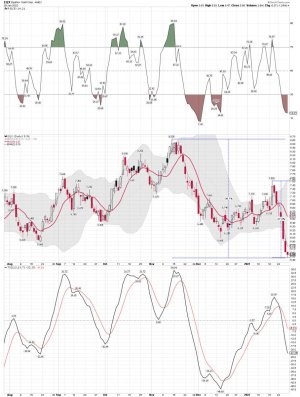
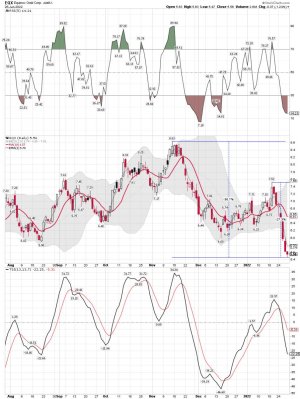
EQX daily: I'm still holding shares..... A real Bloodbath last week......
 

Attachments

  • a.jpg
    a.jpg
    153.8 KB · Views: 77
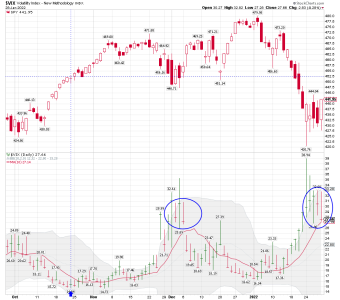
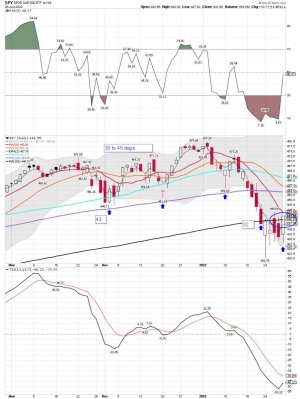
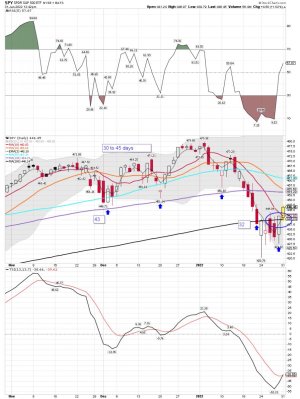
VIX daily: Above average odds for a ST bounce..... Waiting on a confirmed DCL.....and NO WHIPSAW after it's confirmed. This market remains tough to trade..... The dollar move down should help a bounce get started..... We shall see if Friday's move can continue higher, and we have a DCL. SPY needs to get back above its 10 dma.

This Signal Took Its Sweet Time to Get Here
Jeff Clark | Jan 31, 2022 | Market Minute | 2 min read
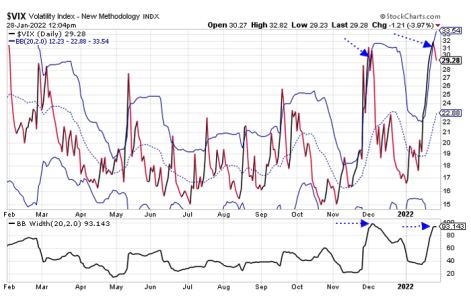
We finally got our first VIX buy signal of the year.

We knew it was coming… The Volatility Index (VIX) closed above its upper Bollinger Band almost two weeks ago. All it needed to do was close back inside the bands, and it would generate a broad stock market buy signal.

It sure took its sweet time getting here…

But we got the buy signal after the stock market closed last Thursday – just in time for Friday’s bounce. And it looks like this buy signal has a lot farther to run.

Let’s take a look at the updated VIX chart, along with its Bollinger Bands…
https://www.jeffclarktrader.com/market-minute/this-signal-took-its-sweet-time-to-get-here/


VIX daily chart:

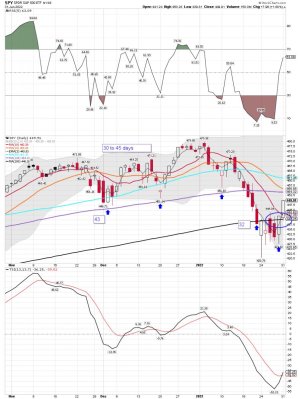
SPY daily chart:
 

Attachments

  • a.png
    a.png
    49.8 KB · Views: 64
  • a.png
    a.png
    37.7 KB · Views: 62
  • a.jpg
    a.jpg
    141.5 KB · Views: 68
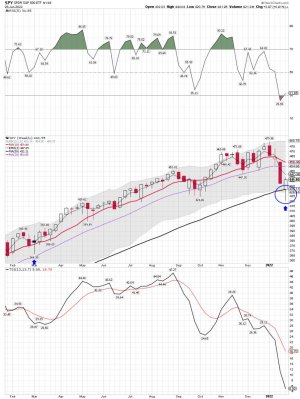
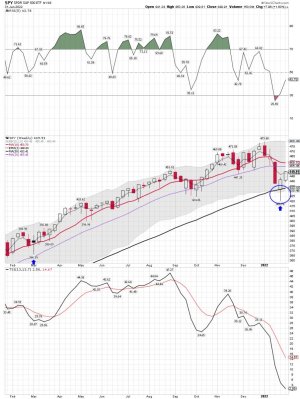
SPY weekly: A possible ICL could be close..... I trade the daily data not the weekly, but ICL's with a confirmed signal can move up for 18 to 25 weeks on average.
 

Attachments

  • a.jpg
    a.jpg
    155.8 KB · Views: 76
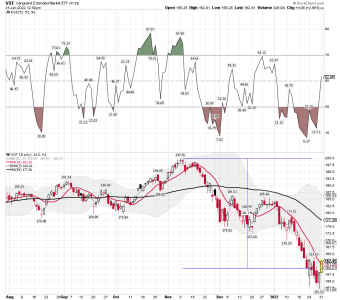
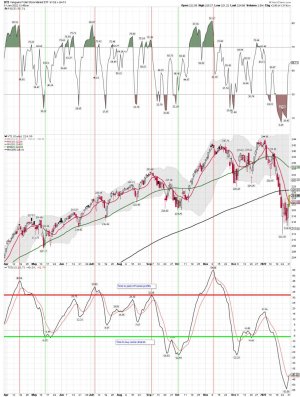
VXF daily: Above the 3 ema and the 10 sma is a good start. We shall see how we close..... Looks like a possible DCL and a new daily buy signal.

SPY daily: C fund same as above

VTI daily : Combo of the C and S funds.....over 4500 stocks.... Best in my opinion for LT positions.
 

Attachments

  • a.png
    a.png
    55.7 KB · Views: 65
  • a.jpg
    a.jpg
    142.7 KB · Views: 66
  • a.jpg
    a.jpg
    134.7 KB · Views: 69
  • a.jpg
    a.jpg
    174.3 KB · Views: 67
Cycle's Video: DCL? I DO NOT trade based on his work, but I respect his cycle work.

Risk or Risk On
January 31, 2022/in NewPublic /by Bob Loukas
https://thefinancialtap.com/2022/01/risk-or-risk-on/

SPY daily: I trade the daily cycles.....

SPY weekly:

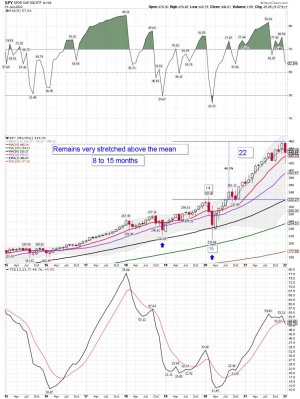
SPY monthly:
 

Attachments

  • a.jpg
    a.jpg
    142.6 KB · Views: 57
  • a.jpg
    a.jpg
    156.9 KB · Views: 58
  • a.jpg
    a.jpg
    159.5 KB · Views: 58
Last edited:
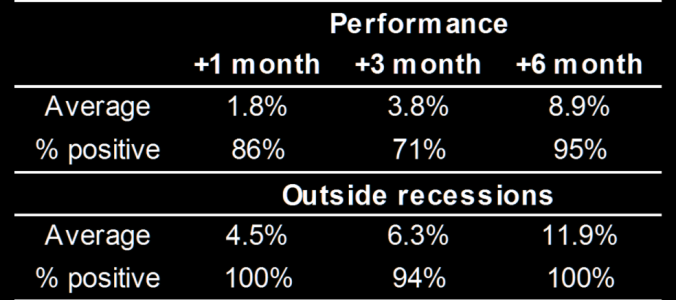
VIX buy signal: up 100% of the times...
JPM Equity strategy: "VIX produced a buy signal last week. Post the signal, 100% of the time SPX was up over the next 1 and 6 months, outside recessions".

https://themarketear.com/
 

Attachments

  • a.png
    a.png
    123.9 KB · Views: 55
VIX buy signal: up 100% of the times...
JPM Equity strategy: "VIX produced a buy signal last week. Post the signal, 100% of the time SPX was up over the next 1 and 6 months, outside recessions".
 

Attachments

  • a.jpg
    a.jpg
    122.7 KB · Views: 58
Fib videos:

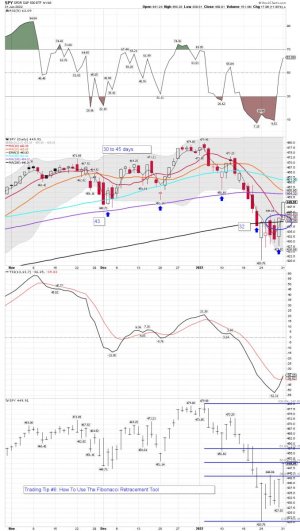
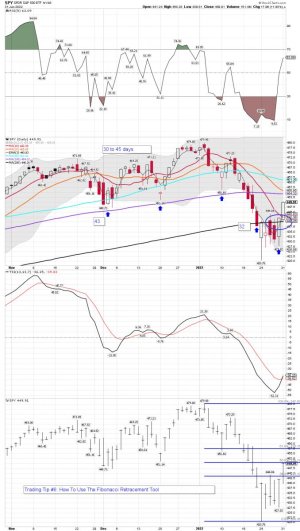
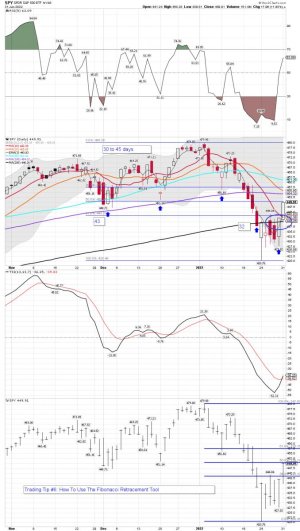
I sometimes track the Fib's after a huge sell-off, but I DO NOT use them for placing trades. Waiting to see how this Fib retracement plays out. Will this move back up be a Right or Left Translated daily cycle?

Cycle Translation

Right & Left Translated Cycle

A cycle is defined by the lowest points of a price series centered around a cycle peak
https://lmtoolbox.wordpress.com/cycle-translation/


Trading Tip #6: How To Use The Fibonacci Retracement Tool
https://www.youtube.com/watch?v=LznyjkxqrDc&t=59s

FIBONACCI RETRACEMENT [For Beginners] - The ULTIMATE Beginner's Guide
 

Attachments

  • a.jpg
    a.jpg
    122.7 KB · Views: 62
Last edited:

Attachments

  • a.jpg
    a.jpg
    125.8 KB · Views: 62
Last edited:
Smoke’em If You Got Them
Posted on January 31, 2022

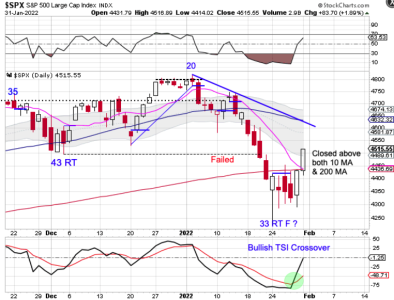
We discussed on Thursday that stocks need to close above both the 200 day MA nd the 10 day MA to signal a new daily cycle. On Friday they came close, but no cigar.

Stocks closed convincingly above the converging 10 day MA and 200 day MA on Monday to confirm the new daily cycle. Looks like its is time to …

https://likesmoneycycletrading.wordpress.com/
 

Attachments

  • a.png
    a.png
    133.5 KB · Views: 63
  • a.jpg
    a.jpg
    45 KB · Views: 62
Back
Top