-
The Forum works well on MOBILE devices without an app: Just go to: https://forum.tsptalk.com
-
Please read our AutoTracker policy on the IFT deadline and remaining active. Thanks!
-
$ - Premium Service Content (Info) | AutoTracker Monthly Winners | Is Gmail et al, Blocking Our emails?
Find us on: Facebook & X | Posting Copyrighted Material
-
Join the TSP Talk AutoTracker: How to Get Started | Login | Main AutoTracker Page
You are using an out of date browser. It may not display this or other websites correctly.
You should upgrade or use an alternative browser.
You should upgrade or use an alternative browser.
Bear Cave 2 (Bull Allowed)
- Thread starter robo
- Start date
robo
TSP Legend
- Reaction score
- 471
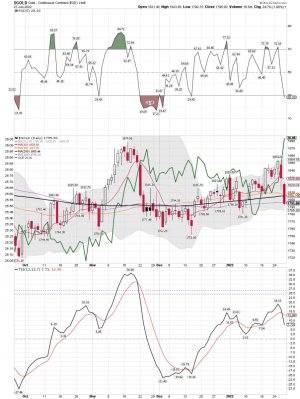
GLD/Miner daily Divergence: As I pointed out earlier today. This divergence should correct in the days ahead. Either GLD is moving lower ( very possible) or the miners should bounce....
LOL...... I lost some new truck money today.....
Getting There:
https://money.cnn.com/data/fear-and-greed/
LOL...... I lost some new truck money today.....
Getting There:
https://money.cnn.com/data/fear-and-greed/
Attachments
robo
TSP Legend
- Reaction score
- 471
The Market’s Sold the Rumor… Is It Time to Buy the News?
Imre Gams | Jan 26, 2022 | Market Minute | 3 min read
Last Wednesday, I pointed out a bearish price pattern in the S&P 500.
I warned that if the index were to break below the support line of that price pattern, we’d likely be looking at a selloff back to around 4306, the lows from October 2021.
nvestors are worried about inflation, and since the start of the year, have been pricing in what they think will be a more hawkish turn by the Fed…
This is what I mean by selling the rumor.
Now for the second half of the equation: buying the news… When the Fed delivers their updated guidance, the market could realize that they overreacted and that stocks should indeed be priced higher.
Of course, we’ll just have to wait and see how the market will react later today.
But don’t be surprised if we get a fierce rally… even if on the surface it would make more sense for the market to sell off based on the actual news.
Happy trading,
Imre Gams
Analyst, Market Minute
https://www.jeffclarktrader.com/market-minute/the-markets-sold-the-rumor-is-t-time-to-buy-the-news/
robo
TSP Legend
- Reaction score
- 471
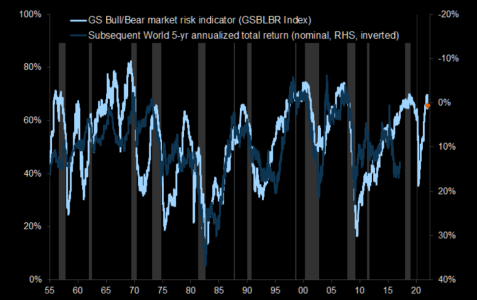
The General deserting? Goldman getting less bullish
Goldman Sachs: "Our bear market risk indicator has increased and points to low future returns. While it has not reached danger zone levels that typically precede a bear market (a fall of at least 20%), it has reached levels which have typically been consistent with corrections and relatively low returns over the next one and five years".
https://themarketear.com/
Attachments
robo
TSP Legend
- Reaction score
- 471
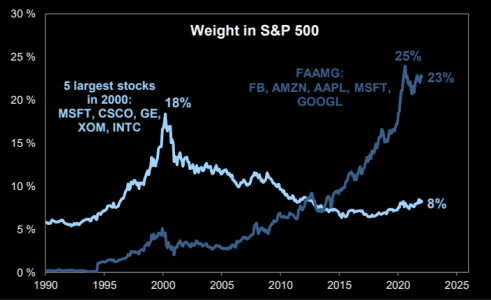
Concentration remains huge...
...and we have seen what can happen when people start selling the tech giants. FAAMG remains elevated at 23% of SPX. Interesting to note is what happened to the old dot.com giants. Imagine the FAAMGs went down the similar path? This would have big implication on many aspects of portfolio management, hedging etc going forward.
https://themarketear.com/
Attachments
robo
TSP Legend
- Reaction score
- 471
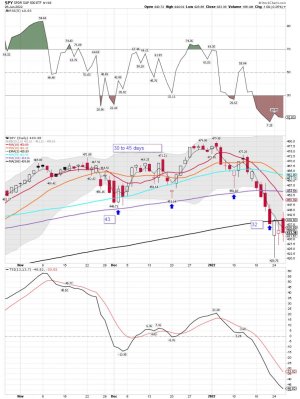
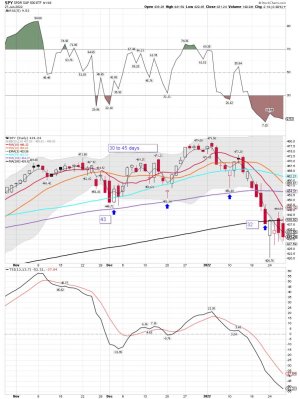
SPY daily: ( C Fund) The Bulls will want to hold above the 200 dma if they can. For me, I be looking for a DCL so I can add to my VXF position.
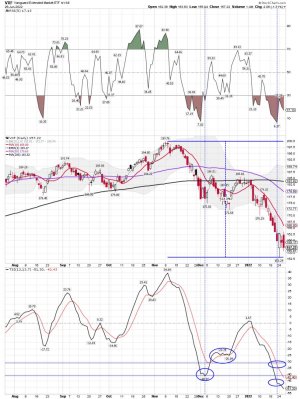
VXF daily: (S Fund) Almost a (-25%) move down from the November high.....
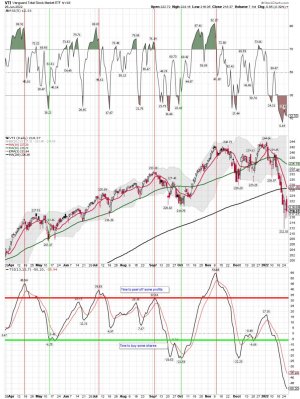
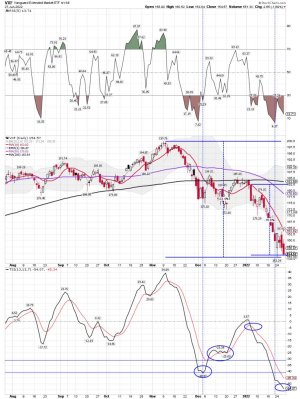
VTI daily: (Combo of C and S Funds) Remains below the 200 dma.....
VXF daily: (S Fund) Almost a (-25%) move down from the November high.....
VTI daily: (Combo of C and S Funds) Remains below the 200 dma.....
Attachments
Last edited:
robo
TSP Legend
- Reaction score
- 471
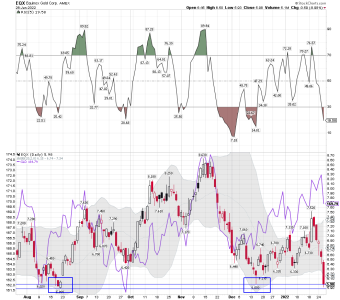
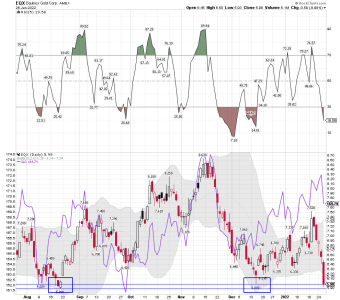
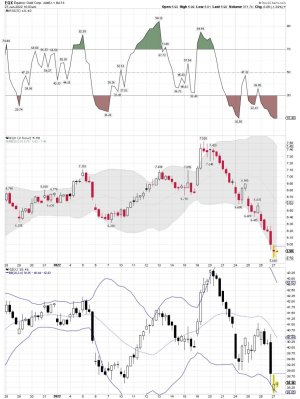
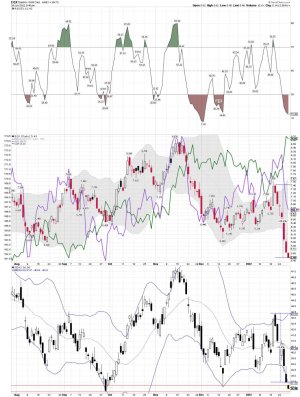
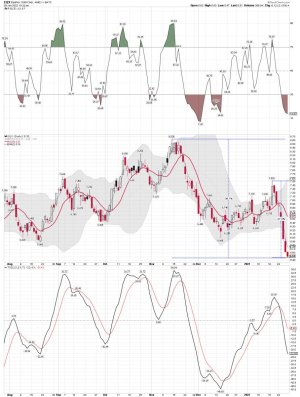
EQX daily: My gold miner trade not doing well due to Fed Speak - Rate increases coming.
EQX testing the August low marker, and made a slight undercut. Looks like more pain for the Gold Miners today. The charts remain very ugly as we move lower....
Long EQX and GDXJ
EQX testing the August low marker, and made a slight undercut. Looks like more pain for the Gold Miners today. The charts remain very ugly as we move lower....
Long EQX and GDXJ
Attachments
robo
TSP Legend
- Reaction score
- 471
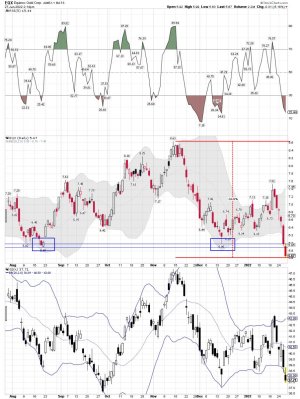
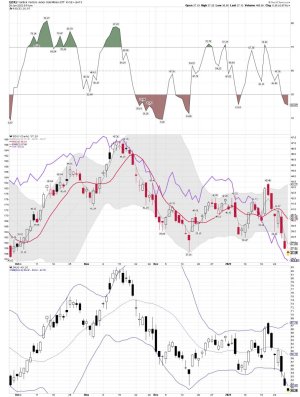
EQX and GDXJ 2 hour Beat down chart: We "MIGHT" be close to an oversold bounce..... We shall see how it plays out. I added some more shares during the morning beat-down. I continue to scale in and see where this goes..... I don't use stops when trading GDXJ at these prices....
https://stockcharts.com/h-sc/ui?s=EQX&p=120&yr=0&mn=1&dy=0&id=p80859595343&a=1103829665
https://stockcharts.com/h-sc/ui?s=EQX&p=120&yr=0&mn=1&dy=0&id=p80859595343&a=1103829665
Attachments
robo
TSP Legend
- Reaction score
- 471
Well I didn't pull the trigger on GDXJ, right when I was going to, someone dumped 167,000 shares of it. Got cold feet after I seen that. I still want to get in, but gonna try to time bottom better. Not sure when that is though.
It's never easy especially when trading in this sector, and that is why I scale in using small tranches. I also keep positions smaller in this sector. I'm currently down around $700.00 on this trade, but I will not be selling. Only adding if GDXJ continues to move lower. I have NO IDEA when GDXJ will bottom. Many will tell you never to add to a losing trade or catch the falling knife, but I do that in small tranches when trading this sector.
The Trend remains down for the miners as the dollar moved up sharply today.
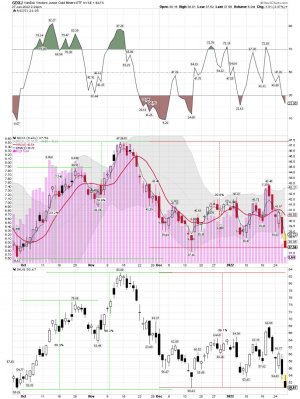
GDXJ is down around (-14%) from its high 6 days, and around (-21%) since it's November high....
GDXJ daily chart after the close: Ugly! In this sector I really like to buy when there is blood in the streets and traders are throwing in the towel. I think we are getting closer, but that is STBD and just a guess based on what I'm seeing. Looking for an oversold bounce....
Take Care!
Long GDXJ, EQX, and VXF
Attachments
robo
TSP Legend
- Reaction score
- 471
Gold and the dollar daily: Gold back below the 200 dma again..... UUP spikes up and gold moves down....
Gold update: Failed breakout
https://blog.smartmoneytrackerpremium.com/
Gold update: Failed breakout
https://blog.smartmoneytrackerpremium.com/
Attachments
robo
TSP Legend
- Reaction score
- 471
Still Seeking A Bottom
Stocks printed their lowest point on Monday.
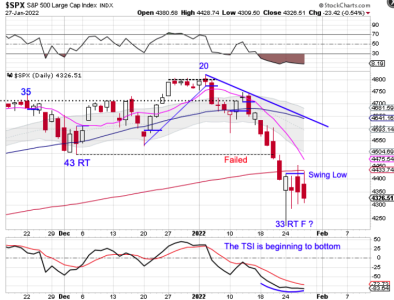
Monday was day 33 for the daily equity cycle, placing stocks in their timing band for a DCL. While stocks did form a swing low on Wednesday, they remain contained by the 200 day MA. With the 10 day MA converging on the 200 day MA, we will need to see a close above both the 200 day MA and the 10 day MA to signal a new daily cycle.
https://likesmoneycycletrading.wordpress.com/2022/01/27/still-seeking-a-bottom/
Attachments
robo
TSP Legend
- Reaction score
- 471
VXF daily: Day 16 since moving below the 10 sma on the daily chart -( a sell signal). VXF is now down around (-16%) since moving below that average.
Bottom Line: The trend remains down as SPY and VXF ( C and S funds) try to find a bottom. VXF remains very oversold under its 200 dma.
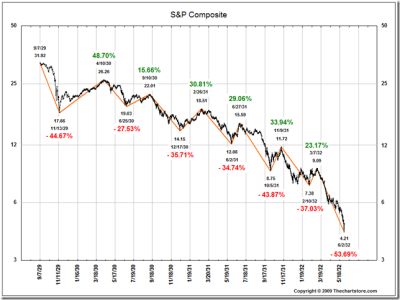
LOL..... Where is the oversold bounce? A guess the long white candle on Jan 24th was it..... So far that marker has held and its still possible that was the low of this move down. We should know in the days ahead. TSP accounts that are in cash, with NO MOVES left, will soon get 2 more as stocks try and bottom and we get a possible a possible tradable oversold bounce. Don't expect it to get easier. I think these huge swing will continue for the rest of the year. Look at the 1929 to 1931 chart below. This market in valuations is closest to that historical time frame.
Long VXF, EQX and GDXJ Another gap down and more pain for my miner positions.
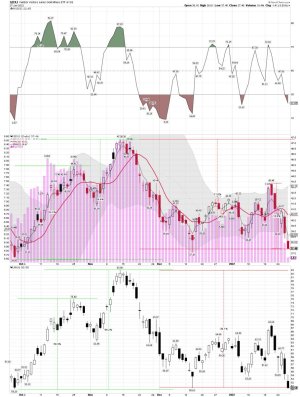
Adding GDXJ this morning around $37.00ish - which is about the current price..... Limit orders in to add additional shares as we move lower. GDXJ testing the October lows.
My cuts are getting deeper as I add!
Attachments
Last edited:
robo
TSP Legend
- Reaction score
- 471
GDXJ and VXF: I wanted to point out why I started buying GDXJ and the miners once GDXJ moved below $40.00ish. Note how GDXJ and VXF move close to each other on the chart. I expected the miners to get an oversold bounce when VXF does. LOL... WHEN? If I would have used my trend-trading system I would still be in a cash position. However, I didn't and I'm now into a losing trade trying to get even, but adding as most keep throwing in the towel. That is what us True Contrarian's do, and that is how I trade GDXJ and the miners. You can bet Steve as adding very small bites at these prices.... The more blood in the streets the more sellers we are seeing. Why is that good? Because many will buy shares back after we bottom and start a new trend to trade.
https://twitter.com/TrueContrarian?ref_src=twsrc^google|twcamp^serp|twgr^author
For now the trend remains down.... I sure wasn't expecting VXF to get this oversold without a oversold bounce. It has been a real bloodbath for such a short time frame. The warning signs were there for sure. Is this an ICL or YCL for stocks? Maybe it is.....
We shall see how it plays out..... For now the Bloodbath for small caps and the miners continues.....
I added some more GDXJ shares @ $36.75
On this chart:
GDXJ= Candlesticks
VXF = Solid purple line
Attachments
Last edited:
robo
TSP Legend
- Reaction score
- 471
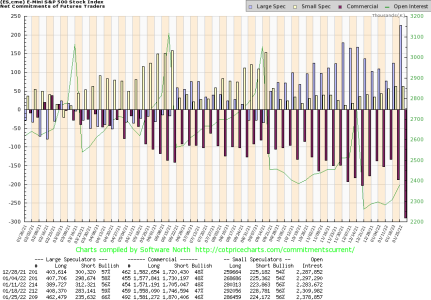
Hmmm.... Someone sure thought this week would be rough......
Weekly COT report: ES
Current Commitments of Traders Charts
Weekly COT report: ES
Current Commitments of Traders Charts
Attachments
robo
TSP Legend
- Reaction score
- 471
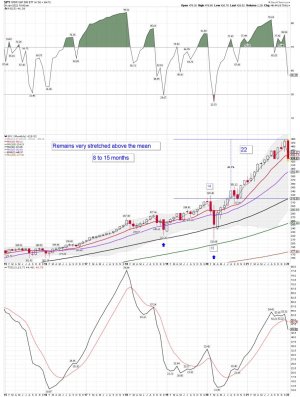
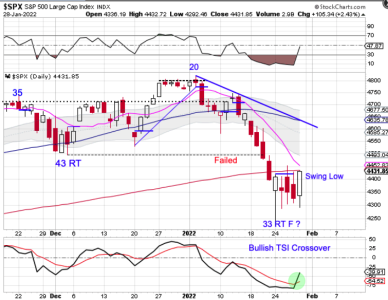
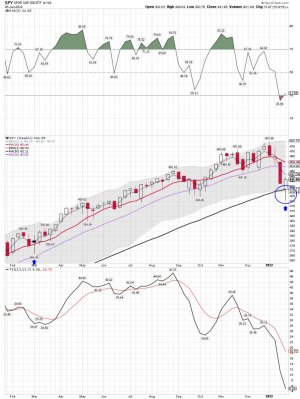
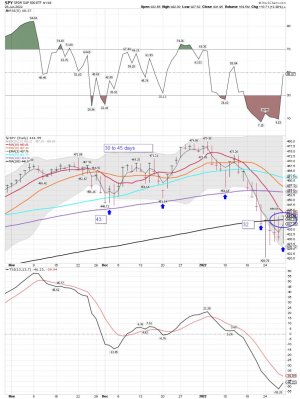
SPY daily cycle data: We shall see if next week if we are starting a new daily cycle. Note the weekly and daily charts.... Maybe close enough for a DCL and the start of a new IC.
Close, But No Cigar
We discussed on Thursday that stocks need to close above both the 200 day MA nd the 10 day MA to signal a new daily cycle. On Friday they came close, but no cigar.
Monday was day 33 for the daily equity cycle, placing stocks in their timing band for a DCL. While stocks formed a swing low on Wednesday and printed a bullish reversal on Friday, they remain contained by the 200 day MA. With the 10 day MA converging on the 200 day MA, we are still waiting to see a close above both the 200 day MA and the 10 day MA to signal a new daily cycle.
SPY weekly chart:
Spy daily chart:
Attachments
robo
TSP Legend
- Reaction score
- 471
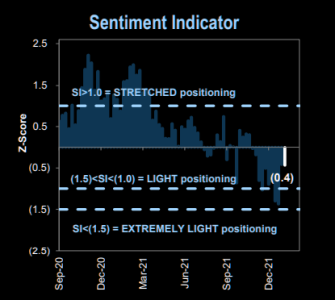
Sentiment: buy signal gone
Sentiment half full half empty....The GS Sentiment Indicator measures stock positioning across retail, institutional, and foreign investors versus the past 12 months. Readings below -1.0 or above +1.0 indicate extreme positions that are significant in predicting future returns
https://themarketear.com/
Attachments
robo
TSP Legend
- Reaction score
- 471
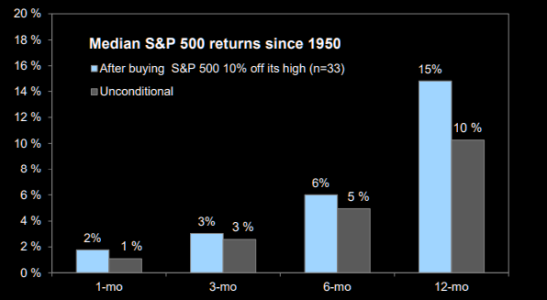
Buy-the-dip: working great since 1950
Past S&P 500 corrections have typically been buying opportunities. Chart 2 shows distribution of 12-month S&P 500 returns following 10% declines
https://themarketear.com/
Past S&P 500 corrections have typically been buying opportunities. Chart 2 shows distribution of 12-month S&P 500 returns following 10% declines
https://themarketear.com/

