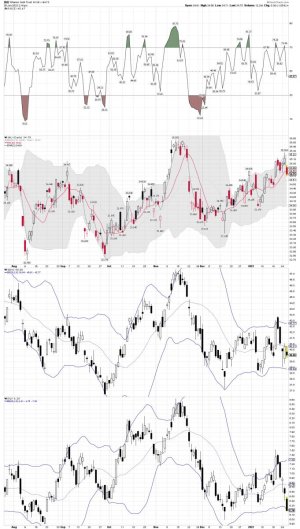
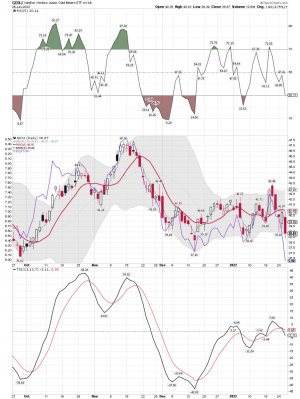
The open looks good so far with a nice gap up!
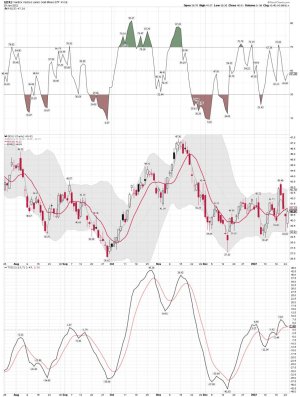
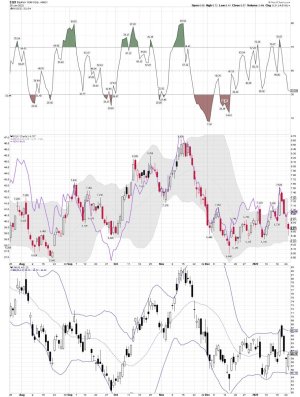
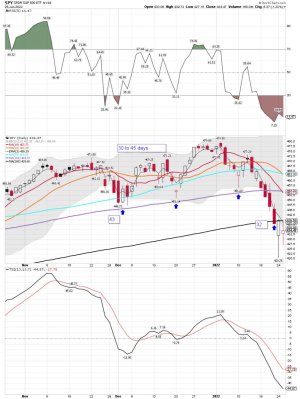
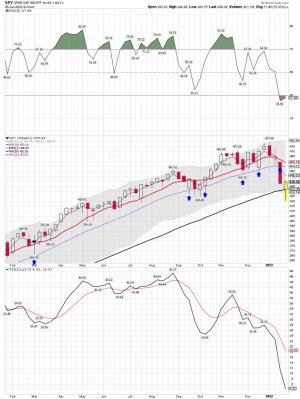
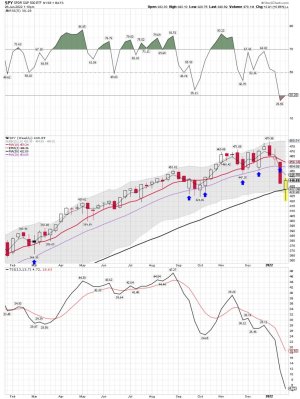
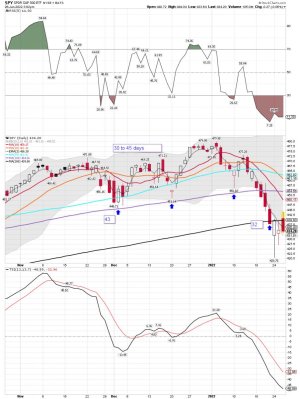
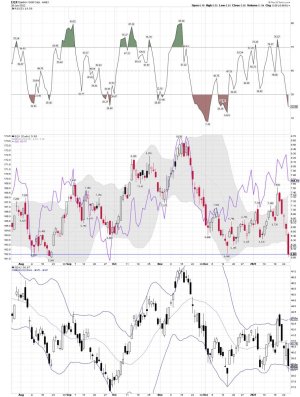
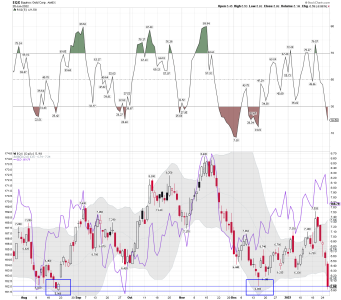
SPY daily (C Fund): Maybe the Buyers can move the SPY back above the 200 sma on the daily. Looks like a green open....
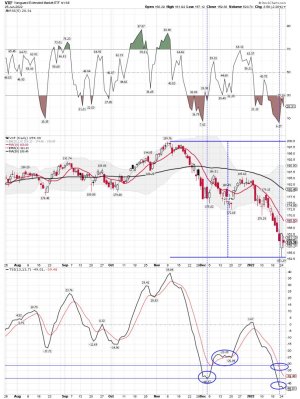
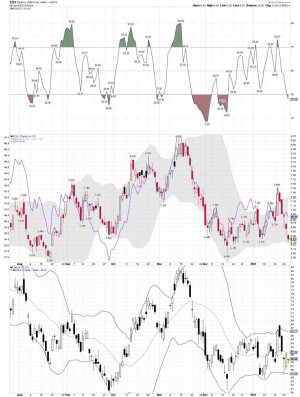
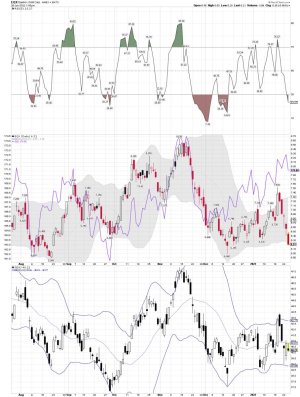
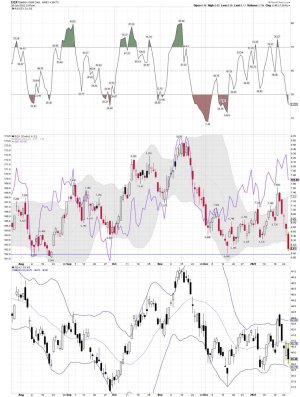
VXF daily ( S Fund): From the high in November down over (-20%)
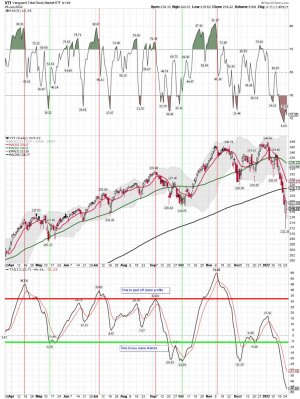
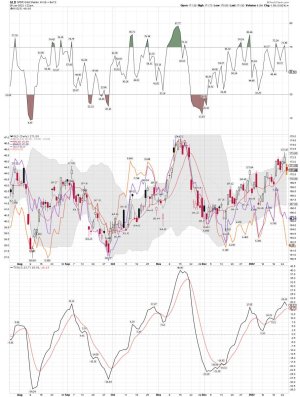
VTI daiy ( The total stock market - A mix of the C and S funds)
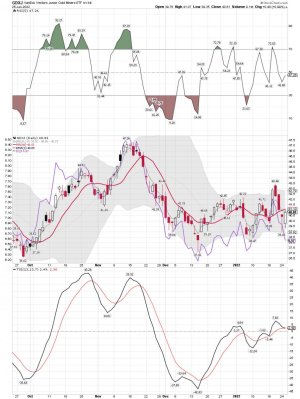
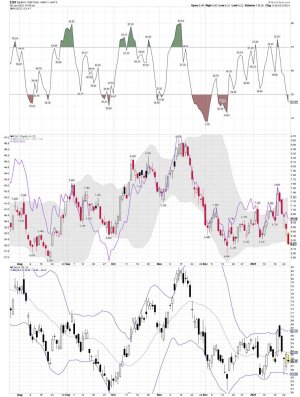
We wait for an ICL as all 3 remain below their 200 sma's on the daily. Also called the 200 dma....
Maybe we will bottom and get an ICL soon. If so that COULD mean we will start a nice trending move for several weeks. However, this year could be full of huge swings in both directions.... I will be playing small ball! Still, I wait for an ICL and a confirmed buy signal. I don't care about the first 10% or the the last 10% of the move. I will take THE MIDDLE with the BEEF, and the lower risk trade. That still doesn't mean it will be a winner, but it sure improves my odds of making money.
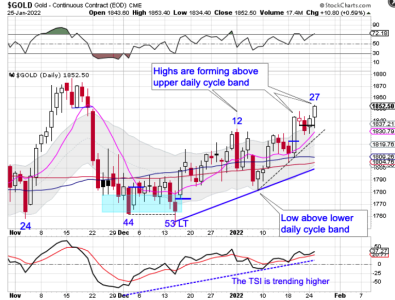
So whay is an ICL? – Intermediate Cycle Low: I will post some weekly cycle charts this weekend, but I trade the daily cycles.
Intermediate Cycles Low (ICL)/ Intermediate Cycle (IC)
ICL – Intermediate Cycle Low
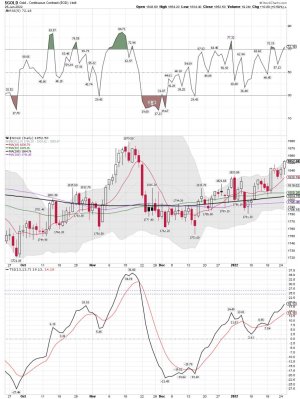
Intermediate Cycle Low’s (ICL’s), happen about 2 or 3 times a year. They show up in both the General Stock market and the Gold and Gold Mining shares as well. These times of the year are the best time to buy at nice discounts.
The SP500 usually has an ICL every 16-25 weeks. The average being 22 weeks.
The Gold market usually has an ICL every 16-23 weeks, with the average being 18 weeks.
The USD market usually has an ICL every 16-23 weeks, with the average being 19 weeks.
The Bond market usually has an ICL every 16-28 weeks, with the average being 21 weeks.
When looking at the charts, use weekly data. This means that each bar on the chart is 1 week’s worth of trading of that security. I look at both Candlestick charts and Line charts. Looking at weekly charts, it is more easily discernible as to where the ICL’s sit on the chart, as depicted below.
https://jorntabel.com/intermediate-cycles-low-icl-intermediate-cycle-ic/
