It was certainly a rewarding day for the bulls as the major indexes began with a large gap higher at the open and never looked back, eventually closing at the high of the day.
Of course we have to assign a reason for this exuberant rally and the word on the street is that it was due to a denial by China about possible reviews of European debt holdings.
Okay...so China gave a confidence boost to the EU's financial problems by not adding to their woes? This is the same China who's economic model and associated fiscal health is held in such high esteem, right?
Okay, got it.
So all Europe's major bourses did was rally in excess of 3%, while the euro posted a 1.5% gain against the dollar.
And of course our own domestic market followed suit with more than 98% of the stocks in the S&P 500 closing in positive territory.
Volume was about average on the NYSE, but advancing volume had a near 10-to-1 advantage over declining volume.
And guess where the S&P is sitting? About 2 points from its 200-day moving average around 1105. Technical analysts will tell you we need to break and close above that mark to consider this rally more than a bearish upthrust.
On the economic data front, the second estimate for first quarter GDP was posted at 3.0%, down from the 3.2% advance estimate and below the 3.3% increase that was expected.
Initial jobless claims for the week was a bit above expectations, while continuing claims saw a modest drop.
So where does the Seven Sentinels sit after this big rally? Here they are:

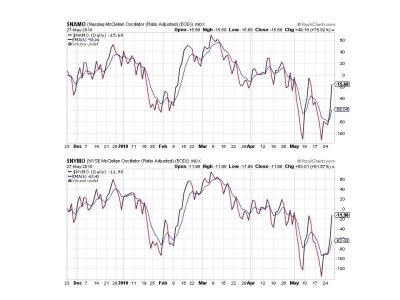
Both signals remain on a buy with higher readings. Of particular note is that NYMO blasted past its 28 day EMA, which according to the newest SS parameters, puts it in a buy condition too.

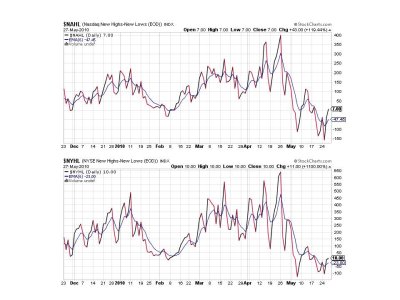
Still on buys here.

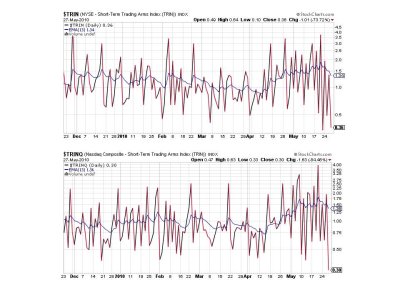
Big time buys here, but showing short term overbought conditions.

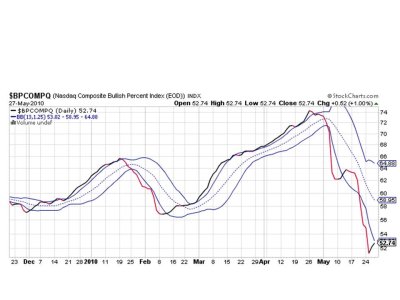
Still on a sell, but very close to initiating a buy.
And that's the only hold out, so the SS remain on a sell. Unfortunately, if this is a turn we can be at even higher levels before the SS finally give a buy signal. This has been a problem for some time given the volatility of this market. Last year a turn like this meant much higher prices on the way, but the last buy signal came on a spike higher that whipsawed the SS into a buy, only to collapse right after. The difference now is that we are bouncing off much lower levels, but that scenario does not guarantee anything.
Overall, I do believe we are turning. I am still 100% S fund and will obviously hold my position given today's action. Sentiment will probably be key as to whether we move higher or not. That's it for this evening, see you tomorrow.
Of course we have to assign a reason for this exuberant rally and the word on the street is that it was due to a denial by China about possible reviews of European debt holdings.
Okay...so China gave a confidence boost to the EU's financial problems by not adding to their woes? This is the same China who's economic model and associated fiscal health is held in such high esteem, right?
Okay, got it.
So all Europe's major bourses did was rally in excess of 3%, while the euro posted a 1.5% gain against the dollar.
And of course our own domestic market followed suit with more than 98% of the stocks in the S&P 500 closing in positive territory.
Volume was about average on the NYSE, but advancing volume had a near 10-to-1 advantage over declining volume.
And guess where the S&P is sitting? About 2 points from its 200-day moving average around 1105. Technical analysts will tell you we need to break and close above that mark to consider this rally more than a bearish upthrust.
On the economic data front, the second estimate for first quarter GDP was posted at 3.0%, down from the 3.2% advance estimate and below the 3.3% increase that was expected.
Initial jobless claims for the week was a bit above expectations, while continuing claims saw a modest drop.
So where does the Seven Sentinels sit after this big rally? Here they are:

Both signals remain on a buy with higher readings. Of particular note is that NYMO blasted past its 28 day EMA, which according to the newest SS parameters, puts it in a buy condition too.

Still on buys here.

Big time buys here, but showing short term overbought conditions.

Still on a sell, but very close to initiating a buy.
And that's the only hold out, so the SS remain on a sell. Unfortunately, if this is a turn we can be at even higher levels before the SS finally give a buy signal. This has been a problem for some time given the volatility of this market. Last year a turn like this meant much higher prices on the way, but the last buy signal came on a spike higher that whipsawed the SS into a buy, only to collapse right after. The difference now is that we are bouncing off much lower levels, but that scenario does not guarantee anything.
Overall, I do believe we are turning. I am still 100% S fund and will obviously hold my position given today's action. Sentiment will probably be key as to whether we move higher or not. That's it for this evening, see you tomorrow.
