alevin's account talk

yep. alevin is a trader now.

:laugh: longer timeframes primarily, ie catching the intermediate trends is the trading objective in tsp. Haven't done so hot with the uptrends but certainly missed the big downtrends, last several years.

so currently intermediate/longterm trend has gone into bear mode as of this week , in DeMark terms (Trade Trekker | Spiral Out – Keep Going), which my new toy (BB x Accelerator Bands x 30-EMA) on weekly/monthly basis (see Freecharts link up above), was already forecasting.

Rule #1-if the trade promptly goes against you, bail! Rule #2-keep your losses small! Maxing out tsp and Roth savings + Cap preservation comes first at my age-retirement possibilities/necessities loom on the not too distant horizon. Hint: I have 10 years on BC. He has more room to take bigger risks.

a) de mark who?

b) too bad i have nothing to risk. or better yet, nothing to lose.
 
Well, since bc so kindly requested that I not just provide commentary in tracker when I make a change this year, I'll go ahead and say something here. Moving back into G today, market is just too unstable right now, as long as the day is up, it's all good. Small loss, its better than a bigger loss, and much easier to recoup. Major drops have bounced off the 30week EMA since early Jan '13, that would take us down to 1750 at minimum, as long as that support held. No g'arantee it will the next time. Already been there done that 3x since Jan13. Next time may not hold, would rather wait and see from sidelines.
 
Play the tape or play the fundamentals...its hard to play the tape when the tape ignores fundamental reality. some people are better at it than others. I don't claim to be one of them. Cap preservation comes first when you're getting close to retirement and jaws of death are in play.

The Fed (And Others) Miss The Point in [Market-Ticker]

Deflation Land

2 of my non-tsp market gurus. There are others. I make longterm decisions based on combination of fundamentals and charts.

Hard lessons gained past few years in brokerage accounts. I've held on too long to bad buys and to good buys with subsequent black swan developments, lesson learned-be slow to buy in first place, be quick to bail when major bad event occurs with potential for non-recovery for really long time. Self-knowledge gained through poor brokerage sell timing decisions associated with Japan nuclear reactor and BP makondo events the past few years.

Are you still watching those weekly EMAs?
 
Are you still watching those weekly EMAs?

Yes, I am-specifically the 30W EMA. and also the monthly 30EMA with accelerator bands x boll bands interactions. I may go in for a dip, but not for a mile-long swim. I have this ambition to have longterm cap gains as my goals in brokerage accts so looking for good value buys in div stocks and nat resource stocks. I still haven't figured out what I want my longterm portfolio mix to look like, one of these days I'll figure it out. til then I keep my buys small and few.
 
30week EMAs say take a small chance. Monthly EMAs say stay cautious. 5%C, 5% I. goal is small gain, move towards rarified air with limited risk. One IFT left this month, if this doesn't play well, may circle in holding pattern and look for lower elevation landing zone for bigger committment.
 

Yah, you betcha. :)

Meanwhile.....back in the real economy....
Consider the following graph of real disposable income, courtesy of Zerohedge.com.

Commenting on the plunge in disposable real income, David K. Barker (marketcycledynamics.com) wrote, “The most shocking thing about [this] is that disinflation is on the verge of deflation when the pumps were running at $85 billion a month. The only real solution is to restore the pricing mechanism of markets, give Mr. Market the deflation he wants, and the global economy can move into the coming long wave spring season sooner rather than later.”
The Deadly Undercurrent of Deflation | Clif Droke | FINANCIAL SENSE
 
OK, I've had enough fun for now, staying on the positive side of zero is always a good thing. taking my pennies and taking a timeout for awhile. Demark counts say not a good time to stay in. weekly price flip last week, downward momentum continuing this week. I may be getting out a hair early, according to other indicators I look at, so be it. my worst failing is not getting back on the horse in timely manner, that's what I need to work on more.

Trade Trekker | Spiral Out – Keep Going
 
Subtle, subtle. I hadn't noticed the DeMark weekly price flip actually happened 3 weeks ago. end of today made it week 3 on the downside, looking for a 9-count down on the weekly before we're done. shall see what we shall see. meanwhile the daily 9-count down cycle is on day 6. looking for a 9 before we're done there. If we get to a 9 before we hit 1773, there's a high probability we'll keep going on the downside for awhile longer, looking for a 13 if we get a 9 that quickly. does it sound like I'm talking bingo?

I'd post a chart with annotation but pretty tired, been on the road almost nonstop for past 3 going on 4 weeks, so am begging off for now. check the tradetrekker for more DeMark details if interested. Trade Trekker | Spiral Out – Keep Going
 
does it sound like I'm talking bingo?

no, i'm pretty good at bingo, but i can't understand any of what you just said.

i have a totally different strategery. it's not working out very well as i just got my butt kicked for about -4% this week and am now negative on the tracker, so i'm not judging or anything.
 
no, i'm pretty good at bingo, but i can't understand any of what you just said.

i have a totally different strategery. it's not working out very well as i just got my butt kicked for about -4% this week and am now negative on the tracker, so i'm not judging or anything.

sorry to hear the miscalculation, b. You'll get it back at some point. As for me, feels good to be both right side up and within a couple points of being in top 200 on tracker, instead of being buried in the bottom 900. I notice that the top trackers are now less certain about F fund as the place to be, good mix of G and F among them as of this morning. I'll be paying attention to their hideouts the rest of the year.
 
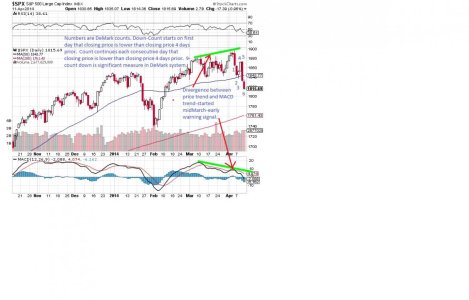
View attachment 28117

Maybe this will be a little closer to bingo-comprehensibility. Maybe. :toung:

huh? what is the picture trying to say? is the market going to go up or is it going to go down?

for example: two green lines going in opposite directions and two red arrow going in opposite directions. i don't get it all. does not compute.
 
huh? what is the picture trying to say? is the market going to go up or is it going to go down?

for example: two green lines going in opposite directions and two red arrow going in opposite directions. i don't get it all. does not compute.

The red arrows are pointing from the comment about divergences, to the actual divergences I'm looking at-the divergences themselves (green lines) are the different directions things are going. When MACD starts heading down at same time prices are still heading up, that is an early warning that prices are likely to take a turn for the worse pretty soon.

The numbers are a countdown-working towards 9 consecutive days in a downtrend. not back to back down days, back to back down days relative to 4 days earlier. Once I see the first down day (relative to 4 days earlier), I start counting to see if there will be 9 consecutive down days.

Once we get to 9 consecutive down days (each one lower than 4 days previous), I look to see if a new count downwards begins. those counts use slightly different counting criteria. We may or may not start a second count from the 9, could get a turnaround or consolidation where the the next 1+ days are not lower or higher than 4 days previous. have to take each day as it comes.

If we suddenly get a closing price higher than 4 days previous closing price, I start a new count upward looking for 9 consecutive days up, using same kind of count. DeMark is a predictive system, not a lagging indicator system. complicated, I have only some of the very basics figured out without a lot of study and refreshers from a book. hope that helps.
 
The comments are pointing to two different predictive indicators. The divergence between price trend and MACD trend means that the price trend is heading for a breakdown sometime soon. early warning. The numbers are a countdown-working towards 9 consecutive days in a downtrend. not back to back down days, back to back down days relative to 4 days earlier. Once I see the first down day (relative to 4 days earlier), I start counting to see if there will be 9 consecutive down days.

Once we get to 9 consecutive down days (each one lower than 4 days previous), I look to see if a new count downwards begins. those counts use slightly different counting criteria. We may or may not start a second count from the 9, could get a turnaround or consolidation where the the next 1+ days are not lower or higher than 4 days previous. have to take each day as it comes.

If we suddenly get a closing price higher than 4 days previous closing price, I start a new count upward looking for 9 consecutive days up, using same kind of count. DeMark is a predictive system, not a lagging indicator system. complicated, I have only some of the very basics figured out without a lot of study and refreshers from a book.

huh?

now my head hurts. 4 day 9 count what?

i can barely keep track on the calendar when the spring concert is or remember to lie on my kid's band practice homework sheet. that is not going to work. some people are hunters and some are gatherers and i don't think people can change fundementally who they are. i just will never be able to do what you are talking about with all that analysis. i'd rather just blow on the dice and let 'em go they roll yo eleven.

still does not compute. can you say it in english?
 
I would think that Alevin is anticipating further drops to continue. I would anticipate a move up from here similar to the one started on February 3rd taking us into higher uncharted territory. All we need is for the Fed to taper their tapering for a few months and zoom up we go. I think the Fed is very aware of the Kress cycles that are bottoming this year pushing inflation into possible deflation - they will pump.
 
I would think that Alevin is anticipating further drops to continue. I would anticipate a move up from here similar to the one started on February 3rd taking us into higher uncharted territory. All we need is for the Fed to taper their tapering for a few months and zoom up we go. I think the Fed is very aware of the Kress cycles that are bottoming this year pushing inflation into possible deflation - they will pump.

finally, english. so market goes up. bet it all on red. got it.
 
I would think that Alevin is anticipating further drops to continue. I would anticipate a move up from here similar to the one started on February 3rd taking us into higher uncharted territory. All we need is for the Fed to taper their tapering for a few months and zoom up we go. I think the Fed is very aware of the Kress cycles that are bottoming this year pushing inflation into possible deflation - they will pump.

I can't say how low things will drop, Birch. From what I read, Kress won't bottom til around October, between now and then, there will be volatility, most certainly. there will be up days and down days, and candlestick patterns and support/resistance levels are better at the day to day, DeMark looks at 4-day patterns at minimum. right now I'm also looking at 4-week patterns, same system, just bigger scale. Yes the fed can do whatever they want and disrupt the developing trends, which is why I watch for longer-term patterns and indicators of potential pattern breaks.
 
Back
Top